To figure out if your content is truly working, you need to dig deeper than the surface-level numbers. It’s about tracking actions that signal real interest—how long visitors stick around, what they click on, and how far down the page they scroll. These are the clues that separate engaged parents from casual browsers.
Beyond Vanity Metrics to Meaningful Engagement
It’s so easy to get caught up in vanity metrics like page views or social media likes. While those big numbers might feel good, they don’t paint the full picture. A spike in page views could just as easily come from people who clicked by accident and left your site within seconds. That kind of data is misleading because it treats every visit as equal, failing to show if your content actually captured anyone's attention.
The real goal is to understand and measure genuine interest. That means shifting your focus to engagement metrics that show active participation. When a prospective parent spends several minutes reading a blog post, scrolls all the way to the end, or clicks a link to learn more about your open house, they’re telling you that your content is valuable and relevant.
What Meaningful Engagement Looks Like
Meaningful engagement isn't a single number; it's a collection of user behaviors that prove your content is hitting the mark. One of the biggest shifts I've seen in measuring content is the move toward prioritizing these more nuanced signals. By 2025, you'll see more and more marketers focusing on metrics like 'engaged sessions'. In Google Analytics 4, this means visits that last longer than 10 seconds, include a conversion event, or have at least 2 pageviews. This simple filter weeds out the accidental clicks and proves someone is actively consuming your content.
To truly get a handle on this, it's essential to learn how to accurately measure customer engagement across all your school's touchpoints, from the website to your emails.
Before we dive into the specific metrics, let's clarify the difference between what looks good and what actually matters. This table breaks down common vanity metrics versus the engagement metrics that provide a much truer sense of content performance.
Vanity Metrics vs Engagement Metrics
| Metric Type | Example | What It Tells You | Potential Pitfall |
|---|---|---|---|
| Vanity Metric | Page Views | How many times a page was loaded. | Doesn't distinguish between a 2-second glance and a 5-minute read. |
| Engagement Metric | Average Engagement Time | How long users actively interacted with a page. | A much stronger indicator of genuine interest and content value. |
| Vanity Metric | Social Media Likes | How many people clicked the "like" button. | Often a passive action with little correlation to deeper engagement. |
| Engagement Metric | Clicks on a Link (CTR) | How many people were compelled enough to click through. | Shows your call-to-action or link was persuasive and relevant. |
| Vanity Metric | Total Followers | The size of your audience on a platform. | A large number doesn't guarantee that anyone is actually seeing your posts. |
| Engagement Metric | Scroll Depth | How far down the page a user scrolled. | Reveals if users are reading beyond the headline and intro. |
As you can see, focusing on engagement gives you actionable insights, while relying on vanity metrics can lead you down the wrong path.
Key Engagement Metrics to Track
Ready to get started? Here are a few powerful indicators of audience interest you should be tracking:
- Average Time on Page: This is a classic for a reason. It shows how long users are actually spending with a piece of content. A longer duration is a great sign that your material is compelling and answering their questions.
- Scroll Depth: This one is fantastic. Tracking how far down a page users scroll tells you if they’re reading your whole article or just bouncing after the first paragraph. Tools like Hotjar or Microsoft Clarity can visualize this for you.
- Interaction Events: This is where you track real actions—clicks on your "Schedule a Tour" CTA, video plays for your "Day in the Life" feature, or downloads of your admissions packet. These are direct signals that a user found your content valuable enough to take the next step.
The core principle is simple: Stop counting visitors and start valuing attention. An article with 1,000 highly engaged readers who stay, read, and click is far more valuable than one with 10,000 visitors who bounce immediately.
Take a look at this screenshot from the "Pages and screens" report in Google Analytics 4. It shows you key metrics like Views, Users, and, most importantly, Average engagement time for each page on your site.
Here’s a pro tip: sort this report by "Average engagement time" (descending). This instantly surfaces the content that is holding your audience's attention the longest, giving you a crystal-clear indicator of your most successful work. These are the pieces you should learn from and create more of.
Choosing the Right KPIs to Match Your School's Goals
Think of your Key Performance Indicators (KPIs) as the bridge connecting the content you create to your school's biggest strategic objectives. If you don't build that bridge, you're just tracking numbers that don't mean anything. The metrics you choose have to be a direct reflection of what you're trying to accomplish—whether that's getting your school's name out there, driving enrollment inquiries, or creating a tighter-knit parent community.
There’s no "one-size-fits-all" list of KPIs that works for every school. The metrics that a high school uses to recruit student-athletes will be completely different from those a preschool uses to fill its summer camp. Your school's context is what matters most.
Aligning Your Metrics with Your Mission
So, where do you start? First, get crystal clear on your primary content goal. Are you trying to attract new families, keep current parents engaged and informed, or position your school as a thought leader in education? Each one of these goals needs its own set of metrics to tell you if your content is actually working.
Let's walk through a real-world example. Imagine your main objective is generating more leads for the admissions office. In this case, vanity metrics like social media likes or general page views aren't your most important KPIs. You need to zero in on metrics that show real intent.
You should be tracking things like:
- "Inquire Now" Form Conversion Rate: Of all the parents who read that blog post about your unique project-based learning curriculum, what percentage actually filled out the inquiry form?
- Viewbook Downloads: This is a huge signal of interest. It shows a family is moving past casual browsing and is seriously considering your school.
- Open House Registrations: This is a direct, high-value action. It proves your content was persuasive enough to get someone to commit their time to visit your campus.
The most powerful KPIs are always tied to actions, not just eyeballs. Your goal isn't just for parents to see your content; it's to inspire them to take the next meaningful step in their journey with your school.
This image really drives home how your primary goal determines which metrics you should be aiming for.
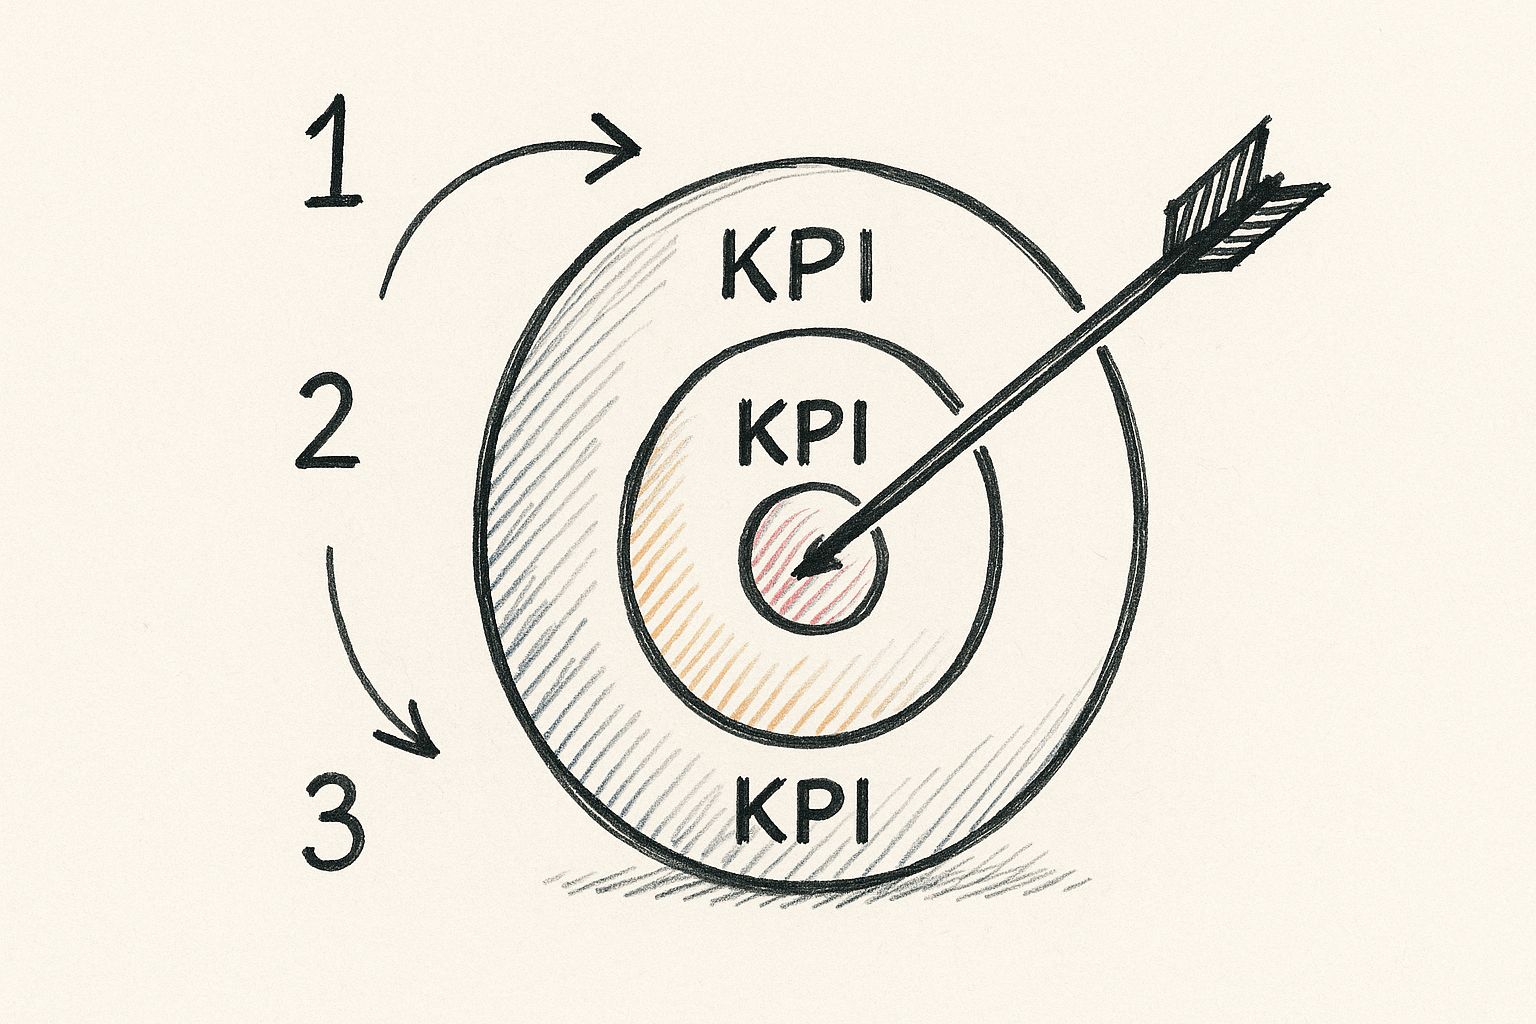
As you can see, the "bullseye"—your most critical KPI—shifts depending on what you're trying to achieve.
Setting Benchmarks That Make Sense
Once you know what to measure, you need to figure out what "good" looks like. Don't just pick numbers out of a hat. The best place to start is with your own historical data. What was your average conversion rate on your Open House landing page last year? That's your baseline.
From there, you can look outward for context. While every school's situation is unique, you can find great resources on key performance indicators for schools that provide solid industry averages to see how you stack up. Most importantly, don't drown yourself in data. Pick the handful of metrics that give you the clearest view of whether you're hitting your main goal.
For instance, if your focus shifts from lead generation to brand awareness, your dashboard will look completely different. Your top KPIs might become:
- Branded Search Volume: Are more people typing your school's name directly into Google? This is a great indicator of brand recall.
- Social Media Reach: How many unique accounts are seeing your posts?
- New Website Users: Is your content successfully bringing new, first-time visitors into your school's digital orbit?
When you thoughtfully select KPIs that are hardwired to your school's goals, you create a powerful measurement system. It not only shows you how to make your content better but also proves its tangible value to your head of school and board.
Connecting Content Performance to Business ROI

Here's the million-dollar question: does your content actually contribute to your school's bottom line? It’s the ultimate test. Tying a blog post or a downloadable guide directly to enrollment revenue can feel like chasing a ghost, especially since a parent's journey often involves dozens of touchpoints over several months.
But to prove your content's value and secure future budget, you have to connect the dots between what you publish and the tuition dollars that follow. The goal is to stop thinking of content as an expense and start treating it like the powerful, revenue-generating asset it truly is.
Demystifying Content Attribution
Attribution is simply the process of giving credit where credit is due. A prospective parent might first discover your school through a blog post about "choosing the right kindergarten," later attend a virtual open house they saw on social media, and finally click a paid ad to submit an inquiry. So, which piece of content gets the credit?
The old "last-click" model, which only credits the final touchpoint, is outdated and misleading. It completely ignores the crucial role your content plays at the beginning and middle of the journey. This is where content-assisted conversions become your best friend.
Inside Google Analytics, you can see how many conversions a specific blog post was involved in, even if it wasn't the final click. This data shows you which articles are successfully introducing new families to your school and nurturing them along the path to application.
For a deeper look at this, you can check out this guide on https://blog.marcomsociety.org/how-to-measure-marketing-roi/ which offers more frameworks to link your efforts to financial results.
The most impactful content often works quietly in the background, building trust and authority long before a family is ready to fill out a form. Your job is to find the data that tells this story.
Integrating Analytics with Your CRM
To get a truly complete picture, you need to connect your website analytics with your school's Customer Relationship Management (CRM) system. This is the bridge that turns an anonymous website visitor into a real, named applicant.
Here’s how it works: when a parent fills out an inquiry form, the tracking information from their website session can be passed directly into their new CRM profile. Suddenly, you can see exactly which blog posts they read before they ever spoke to your admissions team. That’s incredibly powerful information.
You can learn more about effectively measuring content marketing ROI to build a rock-solid business case for your strategy. This approach is no longer a "nice-to-have"; it's a necessity.
In fact, the entire industry is shifting this way. For 2025, over 41% of marketers now evaluate their content's success based on its direct contribution to sales, a trend that demands clear attribution.
Calculating Your Content ROI
Once you have this tracking in place, calculating a basic return on investment becomes surprisingly straightforward. You don't need a degree in finance, just a clear process.
Here’s a simple way to approach it:
- Track Content-Assisted Revenue: First, add up the total enrollment value from families who engaged with your key content pieces.
- Calculate Content Cost: Then, tally up all the expenses that went into creating and promoting that content. Think writer salaries, freelance fees, or any ad spend.
- Use the ROI Formula: Finally, plug those numbers into the classic formula: (Revenue – Cost) / Cost x 100.
This simple calculation is what allows you to confidently answer the ultimate question from your head of school: "Is our content marketing actually making us money?" Now, you'll have the data to prove it.
Building Your Content Performance Dashboard
Let's be honest, all the data in the world is useless if you can't make sense of it. Once you've nailed down your KPIs, the real work begins: pulling that information out of isolated spreadsheets and into a single, cohesive command center. A great dashboard isn’t just a report; it's a living story of your content's performance, giving you a clear, at-a-glance view to make smart decisions on the fly.
This isn’t about drowning yourself in dozens of reports each morning. The goal is to create one go-to place that tells you exactly what’s working, what’s not, and where you should focus your energy next.
Choosing Your Core Data Tools
To build a truly useful dashboard, you need to pull from the right sources. For nearly every school marketer I know, two free tools from Google are the absolute foundation:
- Google Analytics 4 (GA4): This is your window into what happens on your website. It’s where you’ll find out which blog posts have the highest average engagement time, which pages are actually leading to inquiry form submissions, and how prospective families are finding you in the first place.
- Google Search Console (GSC): Think of this as your direct line to Google's search results. GSC shows you the exact search terms parents are using to land on your site, your school's average ranking for those terms, and your click-through rate from the search results page.
When you bring the on-site behavioral data from GA4 together with the organic search data from GSC, you get a powerful, 360-degree view of your content's journey—from initial discovery to meaningful engagement.
Creating Your Custom Dashboard
Now that you know where your data is coming from, it's time to bring it all into one view. You could manually check each platform every week, but a dedicated dashboard tool will save you a massive amount of time and, more importantly, help you spot insights you might otherwise miss.
A fantastic—and free—option is Google's Looker Studio. It's built to connect seamlessly with both GA4 and GSC, letting you drag and drop your chosen KPIs into a clean, visual, and interactive report. If you’re looking for ideas on how to present your data clearly, you can even find inspiration from high-quality PPC reporting templates. Many of the same design principles for visualizing paid ad data work beautifully for organic content metrics too.
A dashboard isn’t a one-and-done project. It’s a dynamic tool that should evolve with your strategy. My advice? Start simple. Focus on your most critical KPIs—like engagement time, top landing pages, and assisted conversions—and then refine your dashboard as you learn what data truly drives your decisions.
Here’s a quick look at what a dashboard built in Looker Studio can look like. Notice how it blends different data points into a single, easy-to-digest screen.

This is where the magic happens. With a visual setup like this, you can spot trends instantly. You can see how a traffic spike from a new blog post directly correlates with an increase in open house registrations—all without juggling multiple browser tabs. Your dashboard becomes your mission control, guiding your entire content strategy.
Turning Insights into Actionable Content Optimization
So, you’ve gathered all this data. Now what? Data is just a bunch of numbers on a screen until you use it to make real, tangible improvements. This is where the magic happens—where your analytics dashboard stops being a passive report and becomes your active playbook for winning at school marketing.
The whole point is to create a feedback loop. Your hard numbers should directly guide your creative decisions. When you systematically review your metrics, you can stop guessing and start making confident choices about what to create next.
Identifying Your Content Winners and Losers
First things first: you need to figure out what’s working and what isn’t. Your dashboard is perfect for this. As you look through your content portfolio, you’ll start seeing patterns emerge, allowing you to sort everything into a few key groups.
You'll quickly spot the high-performers. These are your content "winners." Maybe it's the series of blog posts about navigating the middle school transition or those video interviews with beloved teachers. These are your proven successes, and they give you a clear blueprint for what your audience wants.
On the flip side, you'll have content that's just… there. These are the articles with disappointingly low engagement, next-to-no conversions, and barely any organic traffic. Don't get discouraged! These "losers" are actually your biggest opportunities for growth.
The most valuable insight isn't just knowing what performed well, but digging into the why. Once you isolate the topics, formats, and tones that truly connect with your audience, you've found the formula for repeatable success.
Creating a System for Content Optimization
Now that you’ve sorted your content, you need a plan. Don’t just rush to delete everything that’s underperforming. Instead, think strategically. For any piece of content, you really have three main options: Update, Consolidate, or Retire.
Update Your Existing Content
This should be your go-to move for content that’s on the right track but just needs a little TLC.
- When should you update? Look for articles that get decent traffic but have low engagement or conversion rates. This is a classic sign that the topic is right, but the execution missed the mark. It's also a no-brainer for posts with outdated stats or old school information.
- How do you update? Give it a makeover. Add fresh visuals, embed a new video testimonial, update the statistics, sharpen the calls-to-action, or optimize it for new keywords you’ve uncovered in your Google Search Console data.
Consolidate Related Articles
Do you have a handful of posts that all touch on the same topic? Maybe each one gets a small trickle of traffic, but none are knockouts. By combining them, you can create a single, comprehensive pillar page that has far more authority, user value, and ranking potential. This is a particularly smart way to measure your communication effectiveness when you want to own a single, important topic.
Retire Outdated Content
Sometimes you just have to let go. Certain content simply no longer serves your school. I’m talking about articles promoting events from three years ago or detailing programs that no longer exist. Removing this clutter cleans up your website and ensures prospective families only see what's relevant and useful now. Just make sure you redirect the old URL to a similar live page to pass along any SEO value it might have.
Let’s be honest: creating top-tier content is a constant struggle. A 2025 study revealed that 33% of marketing leaders say creating high-quality content is their single biggest challenge, which naturally affects how reliable their performance data is. If you're curious, you can dig into the latest findings on content performance statistics. This just goes to show that your optimization efforts are part of a continuous cycle of refining and improving, connecting measurement directly back to creation.
Answering the Tough Questions About Content Performance
Even with a solid plan, you're going to run into some tricky situations when you start measuring your content's performance. This is where the rubber meets the road. Let's walk through a few of the most common questions I hear from school marketers, with some practical advice to help you handle them.
How Do I Actually Measure the ROI of Top-of-Funnel Content?
This is the big one, isn't it? You write a fantastic blog post on "The Benefits of a Liberal Arts Education." It gets tons of traffic, but it doesn't directly lead to a flood of inquiry forms. So, what was it worth?
The key here is to stop looking for a direct line to an application and start focusing on proxy metrics and assisted conversions. You're tracking signs of early interest—proof that your content is grabbing the right kind of attention.
Here’s what to look for:
- Newsletter Sign-ups: This is a huge win. A family voluntarily asking to hear more from you is a clear signal of genuine interest.
- Branded Search Volume: Are more people searching for your school by name after that article went live? That’s a great indicator that your content is building brand awareness and recall.
- Assisted Conversions: This is where the magic happens. Hop into your Google Analytics and use a multi-touch attribution report. You can see exactly how many times that "awareness" article was an early touchpoint in a parent's journey that eventually led to an inquiry.
Think of this kind of content as the first handshake. Its job isn't to close the deal on the spot; it's to start a meaningful conversation. You measure its success by how many of those conversations it kicks off.
What’s the Best Attribution Model to Use?
Honestly, there’s no single "best" model that fits every school. The right one really depends on how long and winding your typical enrollment journey is.
If your admissions cycle is super short and straightforward, a Last-Click model might be okay. It's simple and gives all the credit to whatever a parent clicked right before they converted. But for most independent schools, that journey is much longer and more considered.
The biggest mistake I see is schools defaulting to Last-Click attribution. It almost always undervalues the crucial, early-stage content that built the initial awareness and trust.
For a much clearer picture, you'll want to explore other models:
- Linear: This one gives equal credit to every single touchpoint along the way. It’s a fantastic starting point because it helps you see all the different pieces of content that played a role.
- Time Decay: This model is useful if you believe the interactions closest to the conversion are the most important. It gives more credit to the touchpoints that happened right before a family submitted an inquiry.
- Position-Based: This is a popular and balanced approach. It typically gives 40% of the credit to the very first interaction (the discovery) and another 40% to the last one (the decision), then distributes the remaining 20% across all the steps in between.
My advice? Start with a Linear model to get a full, unbiased view of your funnel. From there, you can experiment and see which model most accurately reflects how your families truly find and choose your school.
How Often Should I Be Looking at My Metrics?
Finding the right rhythm for checking your data is crucial. You want to be responsive, but you don't want to get stressed out by normal, daily fluctuations. Trying to analyze your ROI every single morning is a recipe for anxiety.
I've found a two-speed approach works best for most marketing teams:
- A Weekly Check-in: Take a quick look at your leading indicators—things like website traffic, engagement time on key pages, and social media reach. This is your early warning system. It helps you spot big trends or catch technical glitches right away.
- A Monthly or Quarterly Deep Dive: This is your strategic time. Dig into your lagging indicators, the big-picture results like cost-per-inquiry, assisted conversions, and the overall ROI of your content efforts. Giving your campaigns this much time allows them to mature and produce data that's actually meaningful.
This cadence keeps you agile week-to-week while ensuring your long-term strategy is guided by solid, reliable data.
Ready to stop guessing and start building a data-driven marketing strategy for your school? The MarCom Society provides the expert guidance, practical workshops, and supportive community you need to master content measurement and prove your marketing ROI. Join us to access exclusive resources and collaborate with peers who understand your unique challenges. Learn more and become a member of The MarCom Society.