Before you can even think about measuring an event, you have to define what a "win" actually looks like for your school. This means getting crystal clear on your objectives—goals that reach beyond just counting heads and connect directly to what your school is trying to achieve as a whole.
Defining What Event Success Actually Looks Like
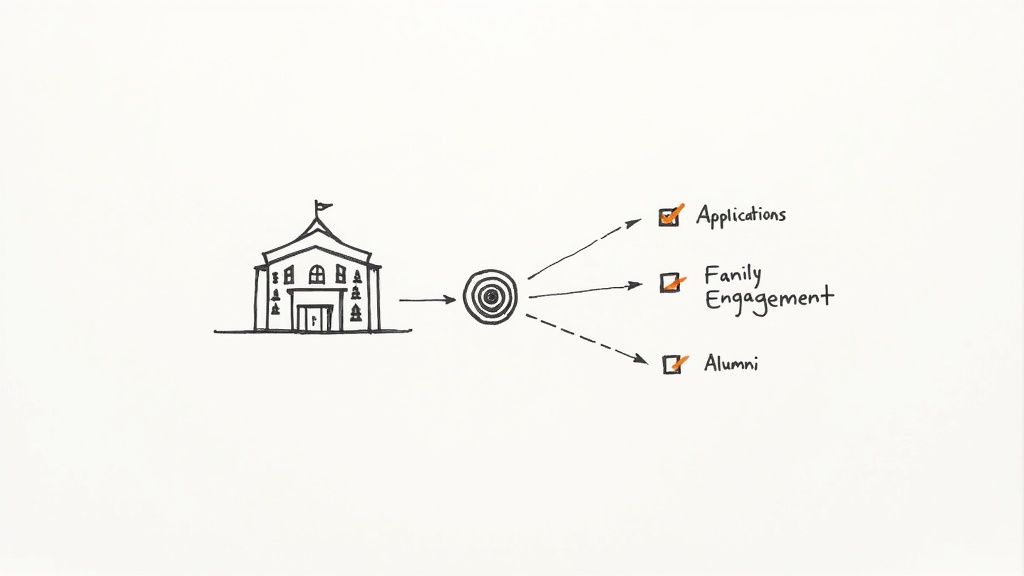
Before you build a dashboard or draft a post-event survey, you need to be honest about what success means. For those of us in K-12 marketing, it’s easy to get caught up in vanity metrics like RSVPs or total attendance. But a packed auditorium doesn't automatically mean more applications are coming in, or that you've strengthened community bonds.
The real starting point is aligning every single event with your school's core mission.
It all boils down to one simple question: "What problem is this event trying to solve, or what opportunity is it trying to create?" The answer has to tie directly back to your school's strategic priorities. A truly successful event is one that moves the needle on what your leadership team actually cares about, whether that's enrollment, retention, or just how the community sees you.
Connecting Events to Institutional Priorities
Think of every event—from a fall festival to a coffee chat with prospective parents—as a strategic tool in your marketing toolkit. Each one is a tactic designed to achieve a much larger objective. The trick is to draw a straight, undeniable line from what happens at the event to a specific institutional goal.
Let's look at a few common school priorities and see how events can play a role:
- Boosting New Student Enrollment: Your open house isn't just a building tour; it's a lead-generation machine. Success isn't measured by how many people walked the halls, but by how many attendees started an application within 30 days.
- Strengthening Community Engagement: That family STEM night is about more than just showing off the science labs. It’s about fostering a real sense of belonging. Here, success could be the percentage of families who say the event made them feel more connected to the school community.
- Improving Current Student Retention: An alumni career day does more than help students. It's a powerful retention tool that demonstrates the long-term value of your school's diploma to current families, reinforcing their decision to re-enroll.
Key Takeaway: True event success isn't about counting bodies in a room. It's about measuring the specific actions and changes in perception that align with your school's most important goals, like increasing applications or deepening family engagement.
Translating Broad Goals Into Measurable Outcomes
Once you’ve linked your event to a big-picture goal, the next step is to break it down into something you can actually count. This is where broad ambitions become specific, measurable outcomes. Sticking to this process keeps you from falling back on vague assessments and gives you hard data to share with stakeholders. There are plenty of powerful event marketing strategies for schools out there that can help put these goals into action.
From Vague Ideas to Concrete Metrics
Let’s see how this works in the real world. A classic goal for an admissions event is to "increase interest among prospective families." That sounds great, but it's too fuzzy to measure. How do you possibly quantify "interest"?
Instead, let's translate that goal into tangible outcomes you can track:
- Objective: Increase qualified leads for the admissions pipeline.
- Measurable Outcome: Generate 50 new inquiries from families with students in our target grade levels.
- Objective: Showcase the strength of our academic programs.
- Measurable Outcome: Have 75% of attendees visit at least two academic department showcases during the open house.
- Objective: Create a positive first impression of the campus and community.
- Measurable Outcome: Achieve a Net Promoter Score (NPS) of +50 or higher on post-event surveys asking about the campus experience.
This framework completely changes the conversation. Instead of just reporting that 200 people showed up, you can now say the event generated 50 qualified inquiries and that attendees rated their experience so highly they would actively recommend the school to others. That’s a story backed by data, and it's the foundation for proving your event’s true value.
Choosing the KPIs That Tell the Real Story
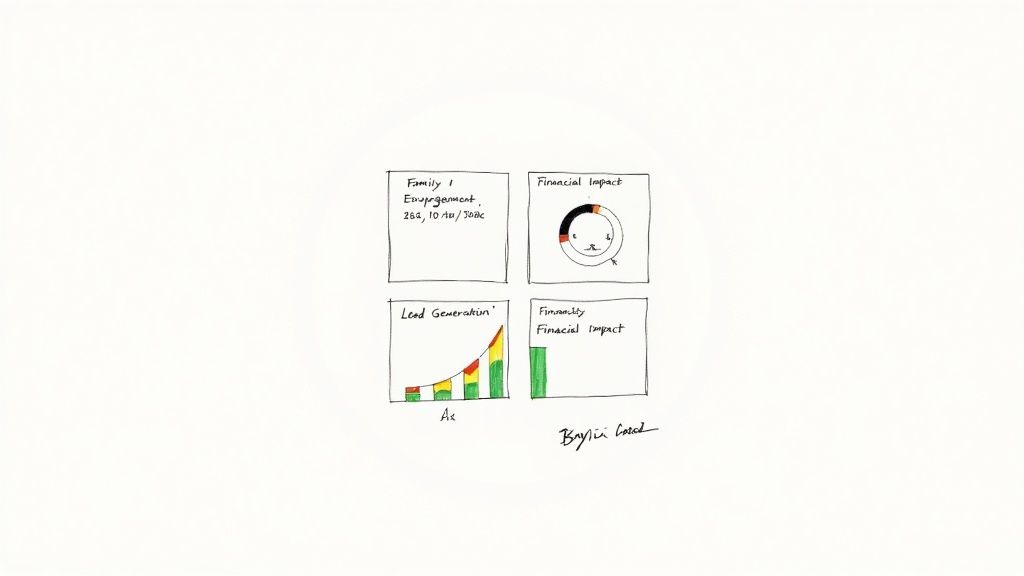
Now that you’ve locked in your event objectives, it's time to pick the Key Performance Indicators (KPIs) that will show you what’s really working. Think of KPIs as the individual threads that, when woven together, create a full and honest picture of your event's performance. They’re the hard evidence that proves your event achieved what you set out to do.
The right KPIs are what take you from simply reporting what happened ("We had 250 people show up") to explaining why it matters ("70% of those families were brand new to our admissions funnel"). This is the key to demonstrating the real strategic value of your work.
Moving Beyond Simple Attendance Numbers
One of the biggest traps I see school marketers fall into is obsessing over attendance. Sure, knowing your registration-to-attendee ratio is useful for checking the pulse of your marketing messages, but it’s just scratching the surface. A truly strong measurement plan digs deeper into the actions and behaviors of the families who actually participate.
Don't just count who walked through the door; watch what they did once they were there.
- Session Participation Rate: At your open house, did more families go to the "Meet the Faculty" session or the financial aid talk? The answer tells you exactly what kind of information prospective families are hungry for.
- Campus Tour Duration: Did families stick around for the whole 45-minute tour, or did you notice a lot of people peeling off after just 20 minutes? This might signal how engaging your tour guides are or point to a less compelling part of the campus visit.
These behavioral clues give you a much richer story than a simple headcount ever could. They show you what prospective families truly value and where you can tweak the experience for even better results next time.
Key KPI Categories for School Events
To build a well-rounded picture of your event’s success, it helps to sort your KPIs into categories that mirror your school's larger goals. This ensures you're measuring success from all angles—not just admissions, but community and financial health, too.
Here’s a look at how you might structure this. The goal is to create a balanced scorecard that leadership can quickly grasp.
| Key KPI Categories for K-12 School Events | |||
|---|---|---|---|
| Category | Primary KPI | Secondary KPI | Example Measurement |
| Family Engagement | Post-Event Survey Score | Session Participation | Achieve an NPS of +60 from attendees |
| Lead Generation | Applications Started | Info Packets Requested | 25% of attendees start an application within 45 days |
| Community Building | Social Media Mentions | Newsletter Sign-Ups | 50+ social media posts using the event hashtag |
| Financial Impact | Cost Per Enrolled Student | Sponsorship Revenue | Calculate the total event cost divided by new students from the event |
This kind of framework connects the dots between your event and the school's bottom line. It's also smart to zoom out and consider the broader key performance indicators every private school should track to see how your events are feeding into the bigger picture.
Measuring What Truly Matters
Let's talk money. Proving financial performance is a huge pressure point for anyone running events. In fact, industry research shows that nearly 40% of organizers struggle to demonstrate a clear return on investment (ROI). It's no wonder that 95% of event teams now say measuring ROI is their top priority.
For schools, this almost always comes down to enrollment. The ultimate financial KPI is the Cost Per Enrolled Student that came from a specific event. You calculate it simply by dividing the total event cost by the number of attendees who ultimately enroll.
Pro Tip: Don't just focus on what happens during or immediately after the event. The most insightful KPIs often track delayed actions. A fantastic leading indicator for enrollment is the percentage of open house families who schedule a follow-up shadow day or private tour.
This long-term view is what separates good measurement from great measurement. It proves that your events aren’t just one-off activities but strategic investments that are actively fueling your school's enrollment pipeline for years to come.
Practical Ways to Collect Event Data
Measuring your success hinges on getting clean, reliable data. For those of us juggling a dozen other marketing tasks, the process has to be simple and efficient—not another time-consuming chore. The trick is to weave data collection right into the event experience, so it feels completely natural for prospective families.
It all starts long before the event day, right at the registration form. This is your first and best opportunity to gather key demographic info and understand who's interested. But there's a delicate balance to strike; you need valuable data without overwhelming a parent who just wants to sign up for your open house.
Focus on what's essential. Beyond the basics like name and email, ask for the prospective student's current grade level and how the family heard about your school. That one "how did you hear about us?" question is pure marketing gold—it tells you exactly which of your channels are actually driving traffic.
Streamline Your Check-In Process
On the day of the event, your check-in table is more than a welcome point; it's a critical data tool. Forget fumbling with printed lists and highlighters—that's slow and a recipe for errors. A slick, digital check-in gives you a precise, real-time count of who actually showed up versus who just registered.
This is where QR codes can be a total game-changer for school events.
- Send a unique QR code in the confirmation and reminder emails to every family that registers.
- Set up a welcome table with a few staff members or parent volunteers armed with smartphones or tablets.
- Scan the code as families arrive. Most event management platforms have a simple mobile app for this, and the whole process takes just a few seconds per family.
This instantly updates your attendance records, giving you an accurate registration-to-attendance ratio. That number is a powerful signal. A high no-show rate might mean your reminder emails aren't compelling enough or that you announced the event too far in advance.
Crafting Surveys That Generate Real Insights
The single most valuable tool in your kit is the post-event survey. This is your chance to go beyond the raw numbers and gather qualitative insights into how families actually felt about the experience. To get honest, top-of-mind feedback, you have to send it out quickly—ideally within 24 hours—while the event is still fresh in their minds.
Your survey doesn't need to be an epic. In fact, a shorter survey usually gets a much better response rate. The goal is to ask a few targeted questions that tie directly back to the objectives you set in the beginning.
A well-designed survey should feel less like an interrogation and more like a conversation. You're trying to understand the family's experience and their perception of your school, not just check a box.
For example, don't just ask a generic, "Did you enjoy the event?" Instead, ask something more specific that gauges their intent to take the next step.
Here are a few questions I've seen work well for a school open house:
- On a scale of 0-10, how likely are you to recommend our school to a friend or colleague? (This is your Net Promoter Score, or NPS, a fantastic benchmark).
- Which part of the open house was most valuable to you and your family? (This tells you exactly what to double down on next time).
- After today's event, what is your perception of our school's academic programs? (This directly measures if you hit your objective of showcasing your curriculum).
- What is one question you still have about our school community? (This is a goldmine for follow-up email content!).
These types of questions give you feedback you can actually use. You can find even more inspiration by exploring different kinds of parent survey questions for school improvement and adapting them for your events. This feedback loop is what helps you refine your strategy and make sure every event you host is better than the last.
Turning Your Data into Actionable Insights
You've done the heavy lifting—collecting surveys, tracking check-ins, and monitoring engagement. Now you’re looking at a spreadsheet full of numbers. The real magic happens next: transforming that raw data into a clear, compelling story about your event’s impact. This isn't just about making charts; it’s about finding the narrative hidden in the numbers that will shape your strategy for years to come.
This process starts when you connect different data points to answer your biggest questions. For example, by cross-referencing your open house attendee list with your admissions database, you can calculate one of the most powerful metrics a school has: the lead-to-application conversion rate.
Discovering that 15% of families who attended started an application within 30 days tells a much richer story than simply saying you had high attendance. It proves the event directly fueled your admissions pipeline.
Likewise, if your registration forms asked families how they heard about the event, you can now see which marketing channels delivered. Did your paid social campaign bring in more families from target zip codes than the local newspaper ad? That’s the kind of insight that helps you spend your marketing budget smarter next year.
Here’s a quick look at how this data collection workflow actually comes together to fuel those insights.
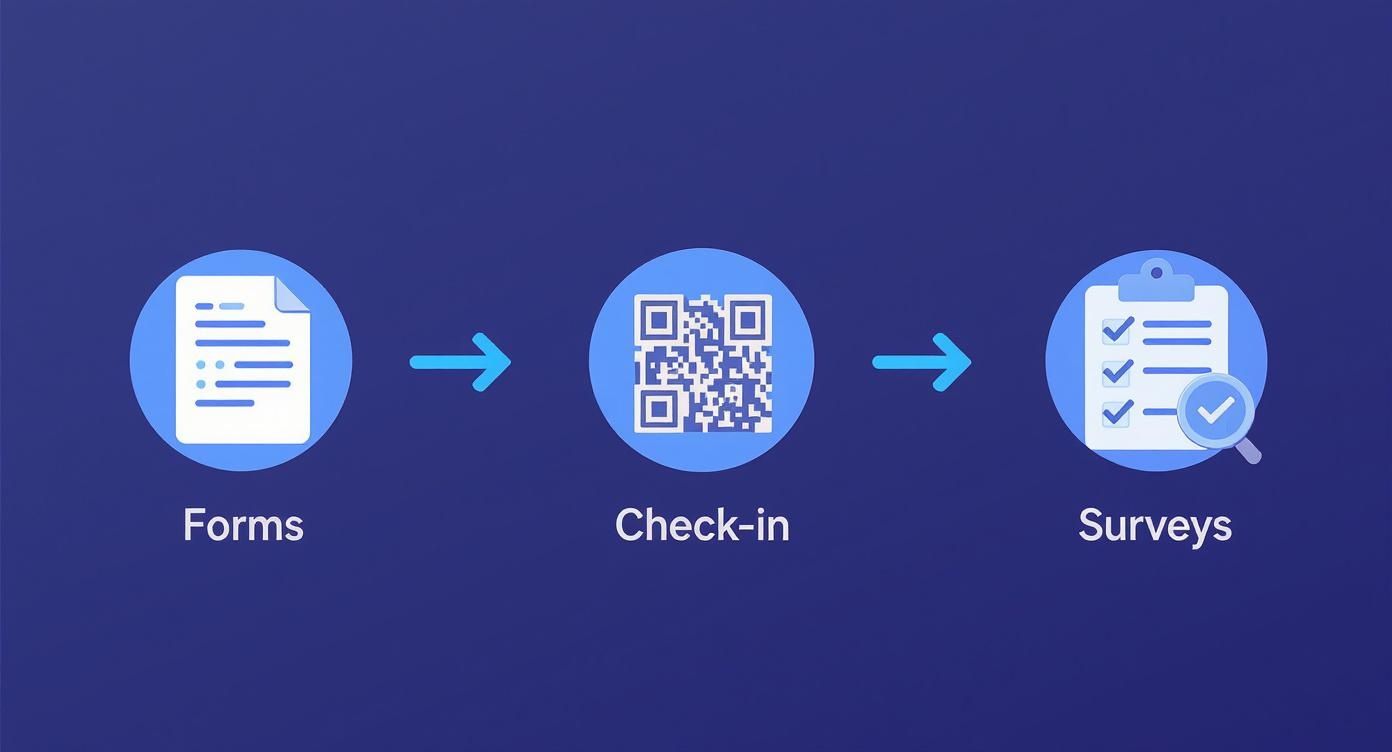
As you can see, data from registration, check-ins, and post-event feedback all flow together to create a complete picture of an attendee's journey.
From Numbers to Narrative
To truly bring your story to life, you need to visualize your key metrics effectively. It’s worth taking some time to explore Business Intelligence dashboard examples for inspiration. These tools are fantastic for spotting trends you might otherwise miss.
For instance, a dashboard could quickly reveal that families who went to the "Meet the Faculty" session had a significantly higher post-event NPS score. That’s a powerful insight. It suggests that direct interaction with teachers is a huge driver of satisfaction and a key selling point for your school.
Don’t forget about engagement, especially as hybrid events become the norm. It's not just about who showed up on campus anymore. In fact, 74.5% of event planners are now navigating the world of hybrid events, and they're watching metrics like virtual session attendance and poll responses very closely. A well-run hybrid open house might see 80% of all participants—both in-person and virtual—actively engaging, which is a fantastic result.
The goal of your analysis isn't just to report what happened. It's to explain why it happened and recommend what to do next. Your data should always be a catalyst for action and improvement.
Tailoring Your Reports for Different Stakeholders
The story you tell with your data needs to change based on who you're talking to. Your Head of School and your admissions team both care about the event's success, but they see it through completely different lenses. A one-size-fits-all report just won't cut it.
Your leadership team needs the big-picture summary. They want to see the strategic value and the return on investment, and they want to see it quickly. For the admissions team, however, the report needs to be granular and tactical, giving them the specific details they need for their follow-up calls and emails.
Thinking about who will read the report is the first step in creating a truly useful document. Here’s a simple breakdown of how you might tailor your event reporting for different audiences.
Event Report Templates for Different School Stakeholders
This table shows how to focus your event report for different leaders within your school, ensuring the information is relevant and actionable for each of them.
| Audience | Key Metrics to Include | Primary Focus |
|---|---|---|
| Head of School | Cost Per Inquiry, Lead-to-Application Rate, Overall ROI, Net Promoter Score (NPS) | Strategic Impact & Financial Return |
| Admissions Team | List of High-Engagement Families, Top Questions Asked, Feeder School Breakdown | Actionable Follow-Up & Pipeline Nurturing |
| Marketing Team | Channel Performance (Cost Per RSVP), Registration-to-Attendee Ratio, Social Media Engagement | Campaign Optimization & Future Planning |
Crafting these targeted summaries is a skill that sets great school marketers apart. If you want to sharpen your reporting game, this guide on how to write marketing reports provides an excellent framework.
By presenting the right data to the right people, you move beyond just justifying an event's budget. You prove that your events are an indispensable engine for enrollment and community growth at your school.
Measuring the Long-Term Impact on Your Community
The real wins from an event often show up weeks, months, or even years after the last guest has gone home. Immediate feedback is great, but the true measure of success for a school event is its lasting effect on your enrollment pipeline and the overall health of your community. It’s about shifting your mindset from one-off activities to strategic, long-term investments.
This means your measurement strategy can't just end when the post-event survey results are tallied. You have to connect the dots between a family's first visit during an open house and their ultimate decision to enroll.
Tracking the Enrollment Journey
The most powerful way to prove long-term value is by directly linking event attendance to actual enrollment numbers. It takes a bit of data discipline, but the story it tells about your impact is undeniable. The goal is to follow an applicant's entire journey, from that first campus visit to their first day of school.
This is where your school’s CRM or admissions software becomes your most valuable tool. By tagging families who came to specific events, you can watch how they move through your admissions funnel over time.
- Initial Touchpoint Tagging: As soon as a family checks in, tag their profile in your CRM with the event name (e.g., "Fall Open House 2024").
- Pipeline Progression: Keep an eye on how many of those tagged families take the next step, whether that's scheduling a private tour or starting an application.
- Enrollment Attribution: Finally, you can calculate the percentage of attendees who officially enroll. This metric—the Event-to-Enrollment Rate—is one of the most compelling KPIs you can share with your leadership team.
This kind of long-term tracking lets you go from saying, "Our Fall Open House brought 200 people to campus," to "Our Fall Open House directly contributed to 15 new enrollments, which is a massive return on our investment."
Monitoring Brand Lift and Community Growth
Of course, not every event is about generating leads. Many are designed to strengthen your school's brand and build that all-important sense of belonging—think community carnivals or a spring arts festival. The ROI on these might feel "softer," but their impact is absolutely measurable if you know where to look.
A great indicator is brand lift, which you can spot in post-event spikes in digital interest. In the weeks after a big community event, dive into your website analytics and Google Search Console. Look for:
- Jumps in organic search traffic for your school's name.
- A rise in direct traffic, which means more people are typing your URL straight into their browser.
- Growth in social media followers and engagement across your channels.
This data proves your event successfully put your school on the map and made it a topic of conversation in the wider community.
Over time, this community growth becomes a critical metric in its own right. A series of successful events can lead to a 20-30% increase in social media followers or newsletter subscribers within six months. This long-game perspective is what helps justify event investments, proving they contribute to the school's vitality well beyond a single afternoon.
Calculating the Long-Term Financial Impact
Ultimately, tying these long-term outcomes back to a real financial value is what solidifies the importance of your event strategy. Once you can track enrollments from a specific event, you can calculate its direct financial contribution.
Let’s say your open house cost $5,000 to produce. If you can attribute 10 new student enrollments to it, and your tuition is $15,000, that one event just generated $150,000 in initial revenue.
This kind of powerful analysis completely changes the conversation. It's no longer about event costs but about event investments, proving that your work is a critical engine for the school’s financial stability and growth.
Your Questions on Event Measurement Answered
Even the best-laid plans run into real-world questions. The daily grind of school marketing always throws a curveball, whether it's justifying the budget for the annual fall festival or pivoting to a virtual open house at the last minute. Let's dig into some of the most common questions that pop up.
How Do I Prove the Value of a Community-Building Event?
This is the big one, right? You know the spring carnival or family movie night is valuable, but how do you show the ROI when it isn't designed to get applications in the door that day?
The trick is to shift your thinking away from hard enrollment numbers and toward metrics that show community health and brand awareness.
Instead of just counting applications, focus on telling a different story with data like:
- Post-Event Survey NPS: A simple question—"How likely are you to recommend our school to a friend?"—can tell you everything. A high Net Promoter Score is solid proof of positive sentiment.
- Newsletter Sign-Ups: Did you get a bump in new subscribers from the community after the event? That’s a direct signal of growing interest.
- Social Media Engagement: Look at how many people used your event hashtag. Did your school's account gain new followers? This is tangible evidence of positive word-of-mouth.
These metrics demonstrate that the event strengthened your school's reputation and expanded its reach in the community. That goodwill is a long-term investment that absolutely feeds future enrollment.
You're telling a story about building a strong, positive connection with local families. That connection is what eventually turns a neighbor into a future applicant.
What Should I Change for a Virtual or Hybrid Event?
When you move online, you lose the ability to read the room. That's why measuring success for virtual or hybrid events means swapping physical observations for digital engagement data. Your event platform becomes your eyes and ears.
Here’s where to focus your attention:
- Dwell Time Per Session: How long did families actually stick around for the "Meet the Head of School" webinar? Longer view times are a clear sign of high interest.
- Chat and Q&A Participation: Don't just glance at the chat log—count the number of unique questions and comments. This is a direct measure of how tuned-in your audience really is.
- Resource Downloads: If you offered a digital viewbook or a curriculum guide, track the download count. It’s a great way to see who is moving from casual interest to serious consideration.
For any hybrid event, segmenting your data is non-negotiable. You need to compare the survey responses and engagement levels of your in-person crowd versus your virtual one. You might be surprised to find that one format works better for certain families or for specific types of content.
Are There Low-Cost Tools to Help Me Get Started?
Absolutely. You don't need a huge budget or a complex analytics suite to get started. In fact, it's often better to start small and build from there. Many free or affordable tools can get the job done beautifully.
Think about putting together a simple, effective tech stack:
- Data Collection: Google Forms or the free tier of SurveyMonkey are perfect for registrations and post-event feedback surveys.
- Data Analysis: A simple Google Sheets spreadsheet is more than enough to organize your data and create basic charts showing registration vs. attendance or tracking your NPS over time.
- Check-In: Platforms like Eventbrite have free plans that include QR code check-in, giving you precise attendance numbers without the clipboard-and-pen hassle.
Starting with these tools helps you build a solid measurement habit. Once you start showing real data that proves your events are working, you’ll have a much stronger case for investing in more specialized software down the road.
At The MarCom Society, we provide the community, resources, and expert guidance K-12 marketers need to tackle these challenges and more. Join our network of school marketing professionals to refine your strategies and elevate your impact. Learn more at marcomsociety.org.