If you want to measure social media engagement correctly, you have to connect every single metric back to a core school goal. Forget about just counting likes. We need to focus on the actions that actually build your community and support what the school is trying to achieve.
True measurement is about understanding how a Facebook share translates into more parents at the annual fundraiser, or how an Instagram save leads to an admissions inquiry. That's where the real value is.
Moving Beyond Likes to Meaningful Engagement
For K-12 schools, social media isn’t just a broadcast channel. Think of it as the digital quad, the modern parent-teacher conference, and the virtual spirit rally all rolled into one. I know the pressure to show results is intense, but too many school marketing teams get stuck chasing "vanity metrics" like follower counts and likes.
While those numbers might look good in a report, they don't tell you much. A high follower count doesn't mean anything if those followers never actually interact with your content. A post with hundreds of likes is just noise if it doesn't spark a single conversation or drive a prospective parent to your website. This is exactly why we need to shift our focus to meaningful engagement.
What Meaningful Engagement Looks Like for Schools
Meaningful engagement is all about quality over quantity. It’s the difference between a parent passively scrolling past your post and an alum actively sharing a fond memory in the comments. For a school, these connections are the bedrock of trust and community. When you figure out how to measure what truly matters, you start seeing the real impact of your work.
Instead of fixating on likes, here’s what you should be tracking:
- Conversation Starters: How many comments did the post about the 5th-grade science fair get from current parents? Are alumni sharing stories on your #ThrowbackThursday posts? This is what a healthy, interactive community looks like.
- Community Amplification: When a parent shares the announcement for the spring musical, they’re giving your school a personal endorsement. Shares, retweets, and story mentions expand your reach through the most trusted voices you have—your own families.
- Intent-Driven Actions: Clicks to the admissions page from a link in your bio, RSVPs to an open house event, or downloads of the new school calendar are tangible results. These actions show your content isn't just being seen; it's compelling people to do something.
- Audience Sentiment: Take a look at the tone of the comments and direct messages you receive. Overwhelmingly positive sentiment from parents and students is a powerful signal of school pride and satisfaction.
The ultimate goal isn't just to be present on social media, but to be purposeful. Every metric you track should answer the question: "How did this activity help us build a stronger school community or move us closer to our enrollment goals?"
Connecting Actions to School Goals
Treat your social media metrics as evidence that your strategy is working. Let's say a key goal for the year is to boost parent retention. Your social media plan might focus on showcasing the vibrant, day-to-day life of your students.
In that scenario, metrics like video completion rates on your "A Day in the Life of a Kindergartener" Instagram Stories or the positive sentiment in comments become far more valuable than the number of likes.
If your primary objective is driving new enrollment, you'd want to prioritize link clicks to your virtual tour page or form completions for an upcoming info session. By aligning your measurement this way, you stop just reporting numbers and start telling a powerful story about your school's impact. To get a better handle on this, exploring the role of social media in building an educational community can offer some great insights.
This strategic approach turns your social media analytics from a simple report card into a roadmap for success.
Defining What Social Media Success Looks Like for Your School

Before you ever look at a single metric, you need a clear destination. A vague goal like “increase engagement” is the social media equivalent of starting a road trip with no map. Sure, you’re moving, but you have no idea if you’re actually getting closer to where you need to be.
For any school, defining what a "win" on social media looks like is the first and most critical step. It's the foundation for a strategy that produces real, tangible results, not just vanity metrics. This means getting past generic objectives and setting specific, impactful targets that truly resonate with your school's unique mission.
From Vague Goals to Actionable Targets
The trick is to translate your school's broad institutional needs into concrete social media objectives. Instead of just chasing higher numbers, think about the specific actions you want your community—students, parents, and alumni—to take.
Let’s reframe a few common, fuzzy goals into powerful, measurable targets a school marketing team can actually hit:
Instead of: "Increase community engagement."
Try: "Boost student-submitted photos for our #SchoolSpirit series by 30% this semester." This goal is specific, measurable, and leans into user-generated content, which is a fantastic indicator of genuine community pride.
Instead of: "Promote our school."
Try: "Drive a 20% increase in clicks to the virtual tour page from our Instagram Stories." This directly links a social media activity to a crucial admissions tool.
These examples show how to measure social media engagement by connecting it to outcomes that matter. It's not just about getting more likes; it’s about getting more applications, more attendees at your open house, and more proud parents sharing your school's story.
Success isn't found in a high follower count. It's found in how effectively your social media efforts support your school's core mission—whether that's enrollment, retention, or community pride.
Aligning Social Media with Institutional Priorities
Your social media strategy can't operate in a silo. Its greatest power is unlocked when it directly supports the big-picture goals of your school. This alignment ensures your work is seen as essential, not just a nice-to-have, and it immediately clarifies which metrics are the most important ones to track.
Take a look at your school's top priorities for the academic year. Are you focused on boosting enrollment for the middle school? Strengthening alumni relations? Increasing donations for a new arts center? Every one of these institutional goals can be supported by a targeted social media objective.
Here's how that connection might look:
Institutional Goal: Increase parent retention by 5%.
Supporting Social Goal: Increase the average number of comments from current parents on Facebook posts by 15% to foster a stronger sense of community.
Institutional Goal: Drive applications for the upcoming school year.
Supporting Social Goal: Generate 50 qualified leads through our targeted Meta ad campaign promoting the fall open house.
This alignment also helps you justify your efforts and budget. When you can show leadership how your social media work contributes to these larger objectives, you're not just reporting on engagement—you're demonstrating real value. It's a fundamental part of learning how to measure marketing ROI in a way that resonates with your head of school and board.
And the audience waiting for you is massive. As of mid-2025, there are around 5.41 billion social media users globally, with about 7.6 new users joining every second. With 95.7% of all internet users on these platforms, the opportunity for schools to connect with prospective and current families has never been bigger. You can explore the latest trends in global social media usage on DataReportal to see the full scope. By setting clear, aligned goals, you can effectively capture the attention of this vast audience.
Choosing the Right Metrics for Each Platform
Okay, you’ve defined what success looks like for your school. Now comes the real work: picking the specific data points that prove you're getting there. A huge mistake I see school communicators make is treating all social media platforms the same. They're not.
A ‘like’ on Facebook isn’t the same as a ‘save’ on Instagram. A retweet on X serves a different purpose than a share on TikTok. Each platform has its own unique language of interaction, and it's your job to become fluent. This is how you connect your school's goals to the right metrics, on the right channel.
This visual breaks down how basic metrics like follower count and total engagements come together to give you a clear engagement rate—a much more telling number.
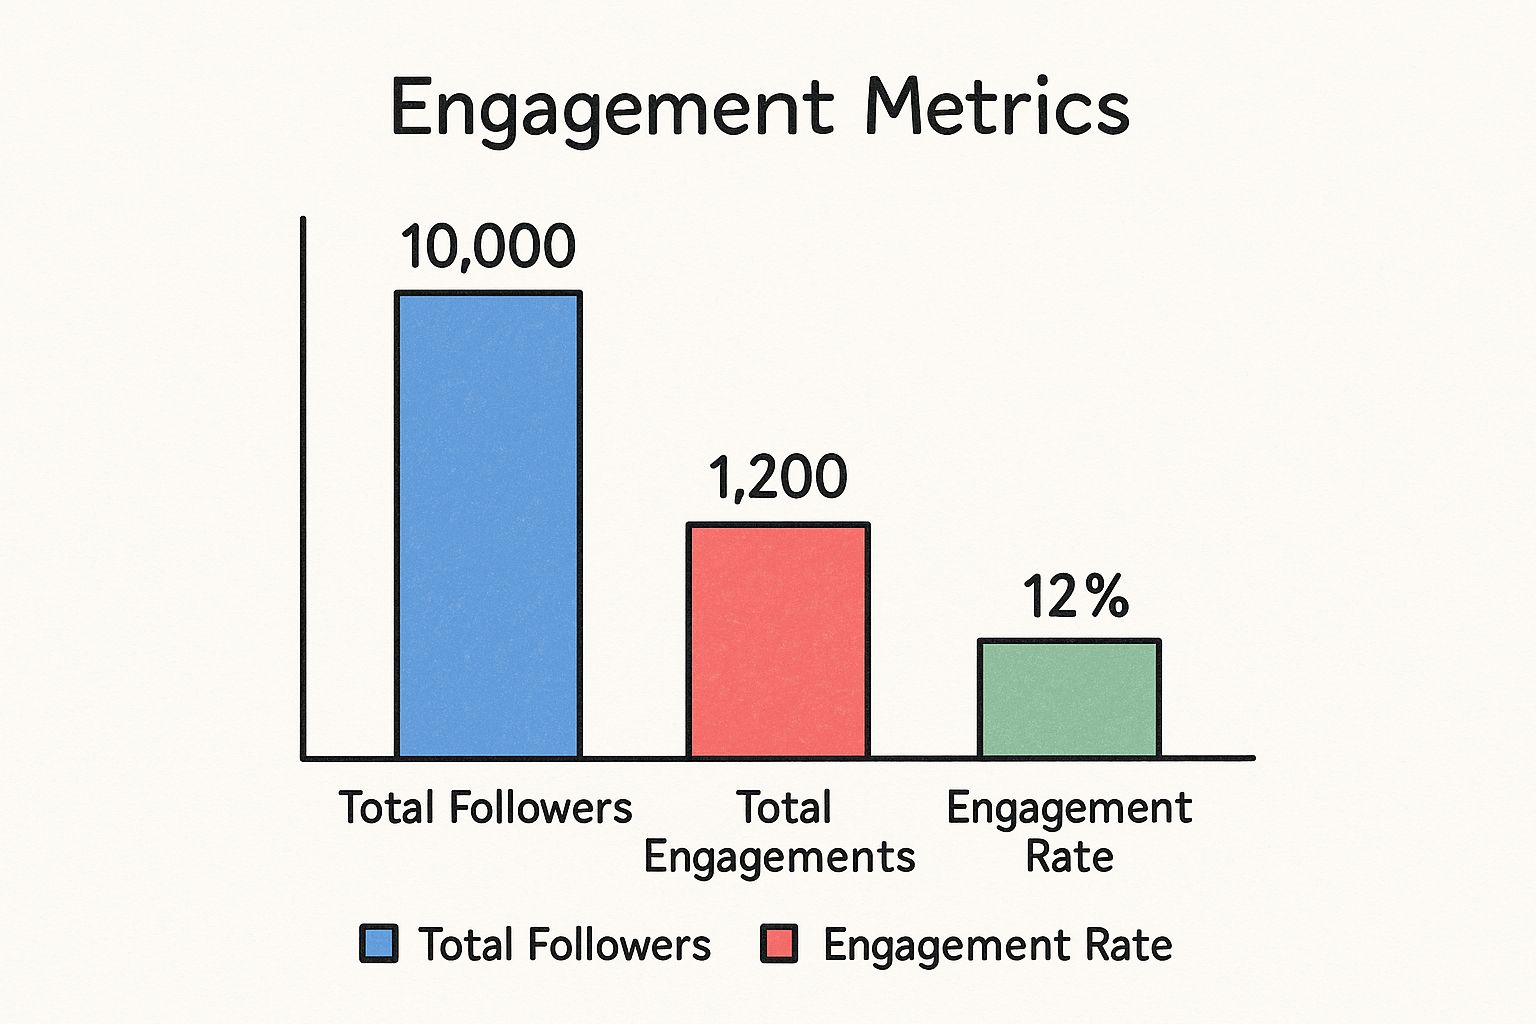
As the chart shows, a big follower count is nice, but the engagement rate is what really tells you if your content is hitting the mark with your community.
A Simpler Way to Think About Engagement Metrics
To make this less overwhelming, I like to group engagement metrics into three practical categories. Think of them as the main ways your audience interacts with your school’s content.
Amplification Metrics: These are the actions that spread your message beyond your immediate followers. When someone shares your content, they’re essentially giving it a stamp of approval to their own network. This is digital word-of-mouth.
- Examples: Shares (Facebook, TikTok), Retweets (X), Story mentions (Instagram).
- Focus on these when your main goal is building awareness—think enrollment season, promoting a big community event, or sharing a major school achievement.
Applause Metrics: These are the quick, low-effort taps. While a "like" doesn't have the same impact as a share, these metrics are a super valuable, at-a-glance signal of what resonates with your audience.
- Examples: Likes, Reactions (Love, Haha, etc.), Favorites.
- Focus on these for a quick pulse check on day-to-day content. They tell you what types of photos, videos, and updates your community enjoys seeing.
Conversation Metrics: This is where you build real community. Comments, replies, and DMs are high-effort engagements. They show people are actively thinking about what you’ve posted and taking the time to respond.
- Examples: Comments, Replies, Direct Messages (DMs).
- Focus on these when your goal is to foster school spirit, get genuine feedback from parents, or build stronger relationships with students and alumni.
A truly healthy social media presence has a good mix of all three. You need content that earns a quick thumbs-up, sparks meaningful discussion, and is compelling enough for your community to share.
Aligning Metrics with School Goals on Key Platforms
Now, let's put this into practice on the platforms most K-12 schools are actually using. It's crucial to tailor your measurement strategy to both the platform and your specific goal.
To help with this, I've put together a table that breaks down which metrics matter most on each major platform, depending on what you're trying to achieve.
Platform-Specific Engagement Metrics for K-12 Schools
| Metric Category | X (Twitter) | TikTok | Primary School Goal | ||
|---|---|---|---|---|---|
| Amplification | Shares | Story Reshares, Post Saves | Retweets, Quote Tweets | Shares, Duets, Stitches | Brand Awareness: Reaching new families, promoting open houses. |
| Conversation | Comments, Replies, DMs | Comments, DMs, Story Replies | Replies, Mentions | Comments, Video Replies | Community Building: Fostering dialogue with parents and students. |
| Applause | Reactions (Like, Love, etc.) | Likes, Story Views | Likes | Likes, Video Views | Content Resonance: Gauging what types of posts resonate day-to-day. |
| Action | Link Clicks, Event RSVPs | Link in Bio Clicks, Poll Votes | Link Clicks, Poll Votes | Link in Bio Clicks | Driving Action: Increasing website traffic, event registration, form fills. |
As you can see, a one-size-fits-all approach just doesn't work. It will leave you with a pile of data but no real insight.
Don't forget that the social media world is always shifting. For example, by 2025, AI will play a much bigger role in how we create and measure content. Early data already shows that 90% of businesses using generative AI are saving significant time, and 73% see a real lift in engagement from AI-assisted content.
This is why using social listening tools is becoming non-negotiable. Teams who use them report being up to twice as confident in their social ROI. To get a handle on what's coming, it's worth exploring some of these powerful social media statistics and trends to stay ahead of the curve.
Ultimately, by focusing on the right signals on the right platforms, you can move from just tracking numbers to truly understanding the story they tell about your school’s community.
Building Your Social Media Reporting System

So, you’ve set your goals and picked your metrics. Now for the real work: building a system that lets you track everything without drowning in a sea of spreadsheets. It’s one thing to collect data, but it’s another thing entirely to turn it into a clear story that guides your strategy and proves your value to school leadership.
An effective reporting system isn't about pulling every number under the sun. It's about creating a smart, sustainable workflow that delivers the right information at the right time. This all comes down to picking the right tools and getting into a consistent rhythm of reviewing your performance.
Choosing Your Tracking and Reporting Tools
You don’t need a huge budget to get this done. Many powerful tools are free, while others offer more advanced features for a price. The most important thing is to choose a tool that actually fits your team’s needs and technical comfort level.
Here are a few options, moving from the simple to the more robust:
- Native Platform Analytics: Your first stop should always be the tools built right into the platforms themselves, like Meta Business Suite (for Facebook and Instagram) and TikTok Analytics. They’re free, reliable, and packed with data on reach, engagement, and audience demographics. They are perfect for daily check-ins and seeing how individual posts are doing.
- Third-Party Management Platforms: When you want a more unified view, platforms like Sprout Social, Hootsuite, or Buffer are fantastic. They pull the analytics from all your channels into one central dashboard, which can save you a massive amount of time. These are especially helpful for creating comprehensive reports and scheduling content in one place.
Whatever tools you land on, the mission is to create one go-to spot where your key metrics live. This single source of truth will save you from the chaotic scramble to pull numbers from five different places right before a meeting. A simple, customized dashboard is truly your best friend here.
Creating a Sustainable Reporting Cadence
Consistency is what makes data genuinely useful. A one-off report is just a snapshot in time; consistent reporting is what uncovers the trends that really matter. To avoid getting overwhelmed, I’ve always found a two-tiered approach works best.
This routine keeps you responsive in the short term while staying strategic for the long haul:
- The Weekly Pulse Check: This is your quick, 15-minute review. The goal isn’t a deep analysis—it’s about spotting immediate trends. Look at your top posts from the past week, check for any weird dips in reach, and get a feel for the comment sentiment. This lets you quickly lean into what’s working or pivot if a new strategy isn’t quite hitting the mark.
- The Monthly Deep Dive: Block off an hour or two each month to go deeper. This is where you’ll measure progress against the big goals you set earlier. You’ll be calculating your average engagement rate, tracking follower growth, and figuring out which content themes drove the most action (like clicks to the admissions page).
This structured process transforms social media measurement from a reactive chore into a proactive habit. It's a key part of understanding your impact, which we break down further in our guide on how to measure content performance.
Your reports need to tell a story, not just list numbers. Always frame your data with context. Instead of just saying, "Reach was 10,000," try this: "Our post about the science fair reached 10,000 people and generated 250 clicks to the event page—that's a 15% increase over last month’s event promotion."
Translating Numbers into a Compelling Narrative
When you present your findings to school leadership, you're not just sharing numbers; you're showcasing the tangible impact of your work. The key is to always connect your social media metrics back to the school's bigger mission. Cut the jargon and focus on the "so what?" behind every data point.
Remember that your audience is busy and wants to see results. It helps to start with some context. The fact that people globally spend an average of 2 hours and 24 minutes a day on social media is a powerful stat to frame your work. This massive time investment, which you can read more about in these game-changing social media statistics from Sonary, highlights why your school absolutely must have a strong presence where your community is already spending its time. Use that backdrop to show exactly how you are capturing that attention for your school.
How to Analyze Your Data for Actionable Insights
You’ve set your goals and have a reporting system humming along. Now for the most important part: turning all that raw data into a real, workable strategy. This is where we stop just noticing that a post got a lot of shares and start asking the crucial question: why?
Think of looking at your analytics less like getting a report card and more like solving a puzzle. The numbers are telling you a story about what your community—parents, students, and alumni—genuinely wants to see from your school. Your job is to listen carefully and use that story to plan what comes next.
Digging Deeper Than Surface-Level Metrics
Let’s walk through a common scenario. You post a high-energy, behind-the-scenes video from the annual science fair. It gets double the engagement of the polished, professional photos from the school play. A surface-level glance just notes the difference. A strategic look asks what this tells you about your audience.
Maybe the raw, unpolished feel of the video felt more real to parents than the formal photos. Perhaps the candid moments of excitement and discovery were more relatable. This is an actionable insight. It suggests your community is hungry for authenticity, not perfection—a lesson you can weave into all your future content.
The point of analysis isn't to find numbers that make you look good. It's to find the truth in what your audience is telling you through their actions. Every comment, share, and click is a vote for the kind of content they find valuable.
To really get what's working, you need a solid benchmark. This is where calculating your engagement rate per post is a game-changer. It creates a level playing field, so you can compare an Instagram Reel to a Facebook photo album fairly.
The most practical formula for schools is Engagement Rate by Reach (ERR):
ERR = (Total Engagements on a Post / Reach of that Post) x 100
This simple calculation reveals the percentage of people who actually chose to interact with your content after it appeared in their feed. A post with a smaller reach but a high ERR is often a bigger win than one with a huge reach but got ignored.
Turning Insights into a Content Roadmap
Your analysis should be the direct inspiration for what you create next. When you start spotting trends, you can identify your most effective content pillars and develop a repeatable approach for success. This process transforms your social media analytics from a confusing spreadsheet into a clear roadmap.
Let's look at another real-world K-12 situation. You’re promoting an upcoming open house on both Facebook and Instagram. After the event, you jump into the data to figure out which platform really delivered.
- Facebook Data: You notice a post with a current parent's testimonial got a ton of shares. Great for buzz! But when you check, the link clicks to the registration page were just okay.
- Instagram Data: An Instagram Story using a countdown sticker and a direct registration link drove 70% of all sign-ups. This happened even though it had fewer "likes" than the Facebook post.
The actionable insight here is huge. First, your Instagram audience is ready to take immediate action. Second, parent testimonials are fantastic for building awareness and trust on Facebook, even if they aren't the final click.
This analysis gives you a much smarter strategy for your next admissions campaign:
- On Instagram: Go all-in on clear, action-focused Stories with easy-to-tap links.
- On Facebook: Keep creating that shareable, feel-good content like testimonials to build community trust.
By constantly asking, "What is this data telling us to do next?" you shift from just reporting on what happened to actively shaping what will happen. This is the heart of measuring social media engagement in a way that truly moves the needle for your school.
5. From Numbers to Action: Making Your Content Smarter

Here's where the rubber meets the road. All the tracking and measuring in the world won't matter if you don't use that information to make better decisions. You've gathered the data; now it’s time to close the loop and turn those numbers into real-world improvements for your school's content.
This is how you stop guessing and start building a social media presence that actually gets better over time.
The best way I've found to do this is with a simple but incredibly powerful cycle: Test, Measure, Learn, Repeat. It’s a framework that forces your strategy to evolve based on what your community truly connects with, not just what you think they want to see.
Putting Your Data to Work
This framework isn't some complex theory. It’s all about being observant and, most importantly, responsive. When your data tells you something, you have to act on it.
Let's say your analytics show that posts featuring student testimonials get 50% more comments than any other content you share. That’s not just a fun fact; it's a huge signpost. Your next move? Plan a recurring "Student Spotlight" series. This takes a one-off success and builds it into a strategic pillar of your content calendar.
Or think about scheduling. You might notice that your parent audience on Facebook is consistently most active around 8 PM after the kids are in bed. Armed with that knowledge, you should immediately start scheduling your most important announcements for that peak time to get the most eyeballs on them.
Your analytics are a direct line to your community's preferences. When they show you what works, your job is to give them more of it. This simple feedback loop is the engine of genuine growth.
A Quick Guide to A/B Testing
You can also use this data-first mindset to fine-tune the smaller details through something called A/B testing. It sounds technical, but it’s not. It’s just trying two different things to see which one performs better. Simple as that.
Here are a couple of easy A/B tests you can run this week:
- Caption Length: Post a great photo with a short, punchy caption. A day or two later, post a similar photo but with a longer, more descriptive story. Which one sparked more conversation in the comments?
- Image Style: Share a polished, professionally shot photo from a recent school event. Then, share a candid, behind-the-scenes shot from that same event. Which one got more shares?
By constantly running these small experiments, you’ll develop a much deeper, more intuitive understanding of what makes your audience tick. You’re no longer just reacting to data—you’re actively shaping it, learning from it, and making your content smarter with every single post.
Your Top Engagement Questions, Answered
Once you start digging into the data, you're bound to have questions. It happens to everyone. Let's tackle some of the most common ones we hear from school marketing pros in the trenches.
How Often Should I Actually Be Looking at This Stuff?
It's easy to get sucked into checking your metrics every five minutes, but that’s not a great use of your time. I've found a rhythm that works for most teams.
Give your analytics a quick glance once a week. This is your pulse check. You're looking for any immediate trends or standout posts that you can learn from right away.
Then, block off time once a month for a proper deep dive. This is when you'll compare your performance against the bigger goals you set, like driving more traffic to the admissions inquiry page. This two-part rhythm keeps you agile without getting lost in the weeds.
What's a "Good" Engagement Rate for a School, Anyway?
This is the million-dollar question, isn't it? While industry benchmarks often cite 1% to 5% as a healthy engagement rate, the real answer is: it depends.
"Good" is completely relative to your school. A small independent school with a tight-knit community on Instagram will naturally see different numbers than a massive public school district on Facebook. The context is everything.
Your most important benchmark is always your own past performance. Are you doing better this month than last month? That’s the real win. Focus on steady improvement over chasing a generic number.
Should I Care More About Reach or Engagement?
They're both pieces of the puzzle, but they tell you different stories.
Reach is your megaphone—it’s how many people saw your post. It's a measure of awareness. Engagement is the conversation that follows—it’s how many people actually interacted with it. This is a measure of connection.
For a K-12 school, your power is in your community. So, while getting big reach numbers during open enrollment season is fantastic, it's the day-to-day engagement—the comments from parents, the shares from alumni, the direct messages from prospective families—that builds the loyalty and school spirit that truly matters.
Ready to connect with a community of peers who are tackling the same challenges? At The MarCom Society, we provide the resources, expert guidance, and collaborative space K-12 marketers need to excel. Join our professional community today!