Marketing analytics is all about measuring, managing, and analyzing marketing data. It’s the process of turning a mountain of raw numbers from your campaigns, website, and customer interactions into a clear, actionable roadmap for what’s actually working.
From Guesswork to Growth: The Power of Analytics

Think of marketing analytics as your business's GPS. Instead of just guessing which roads might lead to new customers, it gives you a clear, data-driven map. This fundamentally shifts your strategy from one based on hunches to one built on hard evidence.
At its heart, marketing analytics is about finding the gold in your data. It helps you answer the big, critical questions that directly impact your school's or district's success. By digging into the numbers, you can optimize your budget, truly understand parent and student behavior, and definitively prove the value of your marketing efforts to stakeholders. For a closer look at the techniques involved, mastering data analysis for marketing success is a great place to start.
Why Analytics Is Essential for Modern Marketing
In a world overflowing with information, relying on intuition alone is like trying to navigate a maze blindfolded. Marketing analytics gives you the vision to see what's just around the corner, allowing you to connect your marketing activities directly to tangible outcomes like increased enrollment or better community engagement.
This isn’t just a passing trend; it’s a massive shift. The global marketing analytics market was recently valued at around USD 6.23 billion and is expected to balloon to USD 11.61 billion in the next five years. That’s a compound annual growth rate of nearly 16.8%—a clear sign that data-driven decision-making is here to stay.
Marketing analytics enables teams to move beyond guesswork and tie performance to outcomes. With the right tools and techniques, teams can understand what works, prove ROI, and improve the customer journey across every touchpoint.
To get a quick handle on what marketing analytics involves, this table breaks down the essentials.
Marketing Analytics At a Glance
| Component | What It Is | Why It Matters |
|---|---|---|
| Data Collection | Gathering raw information from sources like your website, social media, and email campaigns. | You can't analyze what you don't measure. This is the foundation for all insights. |
| Data Analysis | Sifting through the collected data to find patterns, trends, and meaningful insights. | This is where numbers turn into stories, telling you what your audience is really doing. |
| Performance Reporting | Visualizing the findings in easy-to-understand formats like dashboards and reports. | Makes complex data accessible to everyone, from your marketing team to school leadership. |
| Optimization | Using the insights from your analysis to make strategic changes and improve future campaigns. | This closes the loop, ensuring your efforts continuously get better and more efficient. |
Ultimately, these components work together to create a cycle of continuous improvement, turning every campaign into a learning opportunity.
The Core Benefits of Using Marketing Analytics
Adopting a data-first approach gives you a serious competitive edge. It’s about much more than just looking at charts; it's about making real, tangible improvements to your marketing.
Here’s what you stand to gain:
- Deeper Customer Understanding: Move past basic demographics. See how prospective families actually interact with your school's brand, what content pulls them in, and what ultimately drives them to enroll.
- Smarter Budget Allocation: Pinpoint exactly which channels and campaigns are delivering the highest return on investment. This lets you stop wasting money on tactics that aren't working and double down on what is.
- Improved Campaign Performance: Use real-time data to make adjustments on the fly. You can tweak messaging, targeting, and creative elements to get significantly better results from your live campaigns.
- Clearer Proof of Value: Confidently show how your marketing work contributes directly to revenue and the school's overall goals, cementing your team's importance within the organization.
The Four Levels of Marketing Insight
Marketing analytics isn't a one-size-fits-all concept. It’s more like a journey of discovery, with each step revealing a deeper level of understanding. Think of it as climbing a mountain: the higher you go, the clearer and more expansive your view becomes, helping you make smarter choices about where to go next. This journey unfolds across four distinct levels of insight.
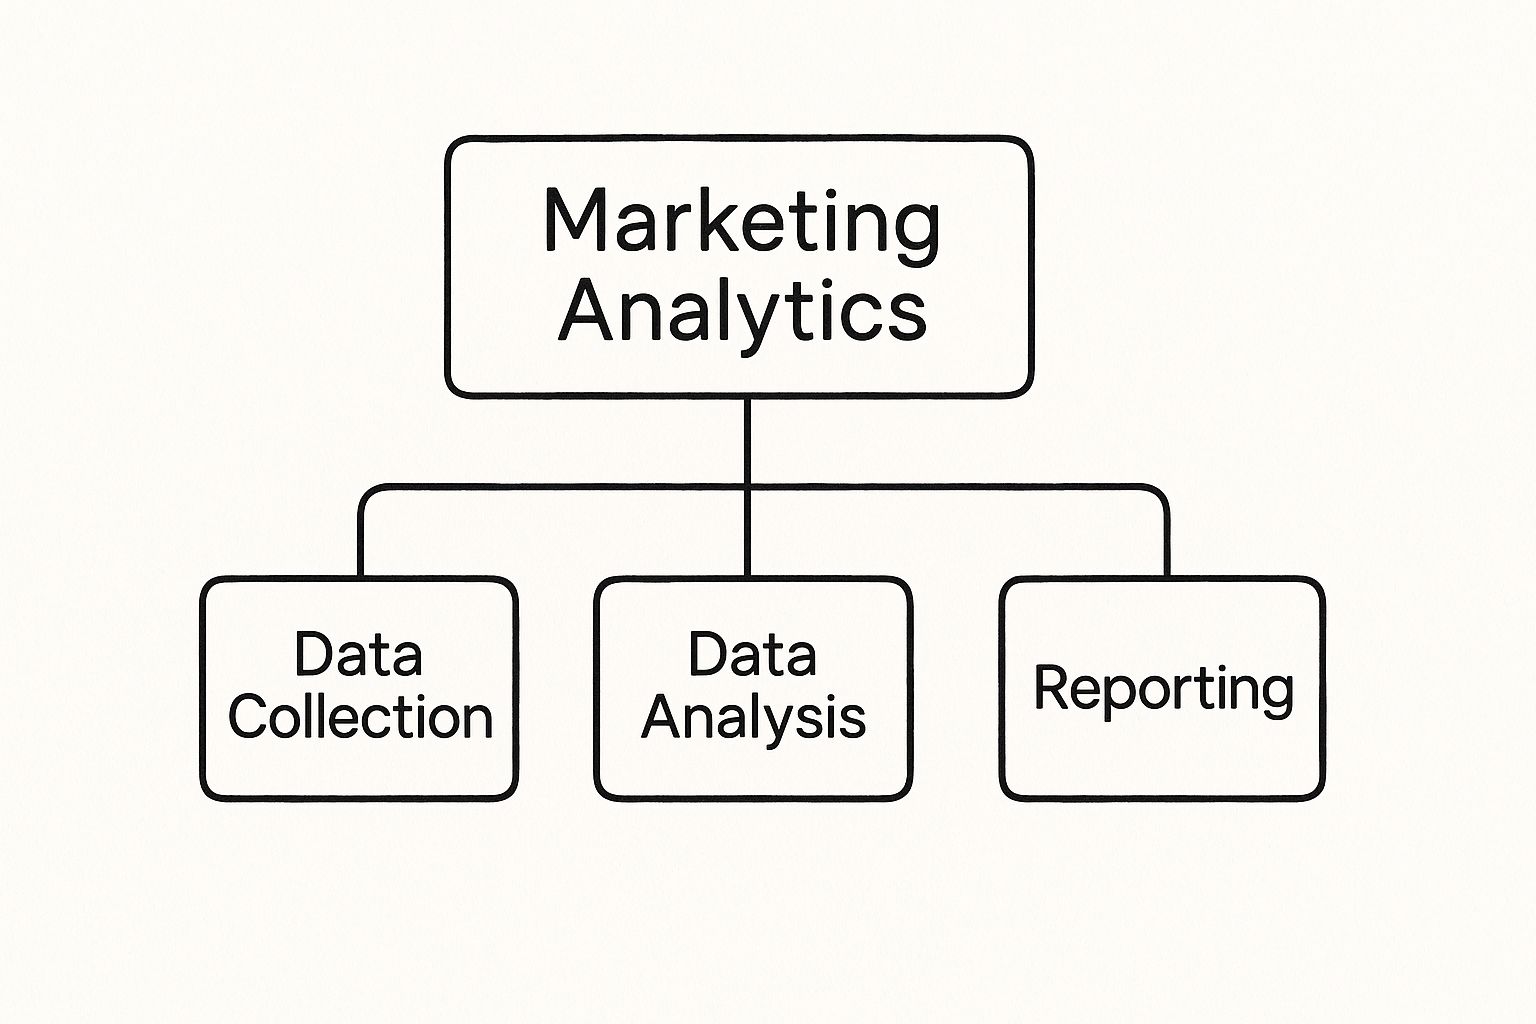
The process always starts with gathering information, moves into analysis, and finishes with reporting that makes the findings useful for everyone on your team. This visual breaks down how those pieces fit together.
Now, let's climb that mountain and explore the four levels of analysis that bring this whole process to life.
Level 1: Descriptive Analytics (What Happened)
We start at the base of the mountain with descriptive analytics. This is the most fundamental stage, and its job is simple: to summarize past data and answer the question, "What happened?" It's the straightforward reporting of historical facts.
For a K-12 school, this could be a monthly report showing 5,000 visits to your website, 300 downloads of your admissions packet, or a 10% jump in social media followers. It doesn't explain why any of this happened, but it gives you a clear, factual picture of your performance.
Level 2: Diagnostic Analytics (Why It Happened)
Moving up, we get to diagnostic analytics. This is where we take the "what" from the first level and dig in to figure out the "why." If your website traffic spiked last month, diagnostic analytics is the detective work you do to uncover the reason.
Was it because a local news station ran a story about one of your students? Or maybe that email campaign promoting your open house really hit the mark? By connecting the dots between different data points, you can diagnose the root cause of your results. This is how you move from just seeing trends to actually understanding what drives them.
Diagnostic analytics turns raw data into a story. It connects cause and effect, giving you the context you need to repeat your successes and sidestep failures.
This kind of insight is invaluable. For example, knowing your open house email led to a 40% increase in website traffic tells you that particular message really connected with prospective families. That's a powerful lesson for your next outreach campaign.
Level 3: Predictive Analytics (What Will Happen)
As we get closer to the summit, our view shifts from the past to the future with predictive analytics. Here, you use your historical data, statistical models, and machine learning to make educated guesses about what’s coming next. You're no longer just looking backward; you’re asking, "What's likely to happen?"
By analyzing past enrollment patterns, you could start to predict things like:
- Which neighborhoods will likely generate the most student applications next year.
- The potential lifetime value of a family enrolling from a specific feeder school.
- Which prospective families might be losing interest based on their engagement with your content.
This is where you get some real foresight. A recent study pointed out that while customer lifetime value (CLV) is a key predictive metric, 37% of marketers don't even measure it because they think it's too complex. But being able to predict which leads will turn into high-value families allows you to focus your time and money where they’ll have the biggest impact.
Level 4: Prescriptive Analytics (What Should We Do)
Finally, at the very peak, you have prescriptive analytics. This is the most advanced and powerful level. It doesn’t just tell you what's likely to happen; it actually recommends specific actions you can take to get the best possible outcome. If predictive analytics forecasts a dip in applications, prescriptive analytics will suggest the best way to stop it.
For instance, it might recommend shifting your digital ad budget from one platform to another, personalizing an email series for a high-value group of parents, or tweaking your website's messaging. This is where data-driven marketing truly comes to life, giving you clear, actionable guidance based on everything you've learned.
Putting Marketing Analytics Into Action
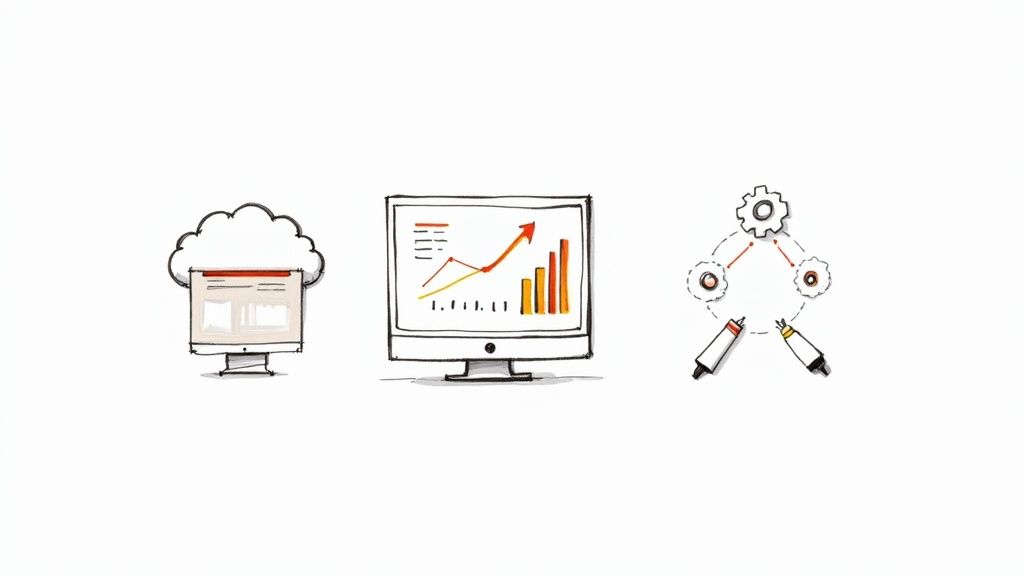
Knowing the different types of analytics is a great start, but the real magic happens when you turn that knowledge into a repeatable process. Don't think of marketing analytics as a one-off project with a start and finish line. Instead, picture it as a continuous cycle of improvement—a flywheel that helps you fine-tune your strategy with more momentum and precision each time it spins.
This process gives you a clear, step-by-step roadmap for getting that flywheel moving. By following these stages, you can build a system that consistently delivers results and turns raw data into your school's most valuable marketing asset.
Stage 1: Set Clear Objectives
Before you even think about looking at data, you have to know what you’re trying to accomplish. Without clear objectives tied to your school's bigger goals, you'll just end up drowning in a sea of meaningless numbers. So, start by asking the most important question: "What does success actually look like for us?"
Is your main goal to increase new student enrollment by 15%? Or maybe you're focused on boosting parent engagement on your social media channels. Setting specific, measurable, achievable, relevant, and time-bound (SMART) goals makes sure every bit of your analytics effort has a purpose.
Stage 2: Identify and Collect the Right Data
Once you know what you’re aiming for, it's time to gather the data you need to measure your progress. This information is usually scattered across your different marketing tools and platforms. To get the full picture, you’ll need to pull from several sources.
Here are the usual suspects:
- Website Analytics: Tools like Google Analytics are your go-to for understanding web traffic, how visitors behave on your site, and where they convert.
- CRM Systems: Your Customer Relationship Management platform is a goldmine of information on prospective families, parent interactions, and the entire enrollment journey.
- Social Media Platforms: The built-in analytics from Facebook, Instagram, and LinkedIn tell you all about engagement, reach, and who your audience is.
- Email Marketing Software: Data from your email campaigns reveals open rates, click-throughs, and which messages actually get parents to take action.
The key is to collect data that directly ties back to the objectives you set in stage one. If enrollment is the goal, you absolutely must be able to track a prospective family from their first website visit all the way to a signed contract in your CRM.
Stage 3: Ensure Data Quality and Processing
Let's be honest—raw data is almost always a mess. It can be incomplete, full of duplicates, or just plain inconsistent. This stage is all about rolling up your sleeves and cleaning it up so it’s accurate and reliable. That means removing duplicate contacts, fixing typos, and making sure all your formats match.
High-quality insights can only come from high-quality data. Skipping this "janitorial" work is a common mistake that leads to flawed conclusions and misguided strategies.
Think of it like cooking a meal. You wouldn't throw unwashed vegetables into the pot. Cleaning your data is the essential prep work that guarantees a much better final result.
Stage 4: Analyze the Data to Find Insights
Now for the fun part: the analysis. This is where you start turning all that clean data into real insights. Using the four levels of analytics we covered earlier, you can begin to spot the patterns, trends, and opportunities that were hiding in plain sight.
Start looking for connections. Did that blog post about your new STEM program cause a spike in website traffic from certain zip codes? Does a higher email open rate actually lead to more tour requests? This is the heart of what marketing analytics is—connecting your marketing actions to real-world outcomes. For a deeper look, our guide on data-driven decision-making provides some great frameworks for this.
Stage 5: Visualize and Communicate Findings
Brilliant insights are totally useless if they're stuck in a spreadsheet that no one understands. This stage is all about translating your findings into clear, compelling visuals like dashboards, charts, and simple reports.
Good data visualization tells a story. A simple line graph showing the jump in open house sign-ups right after you launched a targeted ad campaign is way more impactful than a table of raw numbers. Your goal is to make the data easy to grasp for everyone, from your marketing team to the head of school.
Stage 6: Act on Insights and Iterate
This is it—the final and most important stage. You have to act on what you've learned. Based on your analysis, you can now make smart, informed decisions to improve your marketing strategy. This is what closes the loop and keeps the flywheel spinning.
If the data shows that LinkedIn ads are bringing in fantastic leads, maybe you shift more of your budget there. If a certain email subject line bombed, you test a new one next time. This constant cycle of measure, analyze, act, and repeat is exactly how you achieve continuous improvement and long-term growth.
Choosing the Right Marketing Metrics to Track
It’s incredibly easy to get lost in a sea of data. With countless metrics at our fingertips, the real challenge isn't just collecting numbers—it's focusing on the right numbers. Not all metrics are created equal; some are just interesting tidbits, while others, our Key Performance Indicators (KPIs), tell us if we're actually winning.
Think of it like being a pilot. The cockpit is filled with hundreds of dials, but the pilot keeps a laser focus on the critical few—altitude, speed, and fuel—to get to the destination safely. Your KPIs are those critical dials for your marketing. They tell you, in no uncertain terms, if you're on track to hit your goals.
Website Performance Metrics
For most prospective families, your school's website is the very first impression. It's your digital front door, and understanding how people behave once they walk through is non-negotiable. The right metrics will tell you if your message is landing and if your calls to action are actually compelling.
Here are two essential KPIs to watch:
- Organic Traffic: This is the number of visitors who find you through a search engine like Google, not from a paid ad. A steady climb in organic traffic is a fantastic sign that your content is hitting the mark and your SEO efforts are paying off.
- Conversion Rate: This is the percentage of visitors who take the next step you want them to, like filling out an inquiry form or signing up for a campus tour. A strong conversion rate means your website is successfully turning casual browsers into genuinely interested leads. To dig deeper, check out our guide on how to analyze website traffic.
Paid Media and Advertising Metrics
When you're putting real money into advertising, you have to know if it's actually working. Paid media metrics get straight to the financial impact of your campaigns, helping you justify your budget and, more importantly, spend it smarter next time.
Key metrics for any paid advertising include:
- Return on Ad Spend (ROAS): This is the ultimate bottom-line metric. It measures how much revenue you generate for every single dollar you spend on ads. A ROAS of 4:1, for instance, means you're making $4 for every $1 you put in.
- Customer Acquisition Cost (CAC): This metric tells you exactly what it costs, on average, to bring in a new student through a specific campaign. A low CAC is a clear indicator of an efficient and profitable marketing funnel.
To truly get a handle on the financial health of your marketing, you have to know how to calculate marketing ROI. It goes beyond ROAS to give you the full profitability picture.
Email Marketing Metrics
Email is still one of the most direct and personal ways to connect with families. But firing off emails into the void isn’t a strategy. You need to know if your messages are being opened, read, and acted on. The right metrics reveal the health of your email list and the power of your content.
Keep your eye on these two powerful KPIs:
- Click-Through Rate (CTR): This measures the percentage of people who clicked on at least one link inside your email. A high CTR is great feedback that your message was compelling and relevant enough to make someone take action.
- Conversion Rate: Just like on your website, this tracks how many people completed a goal after clicking through from your email. This could be registering for an open house or starting an application, directly connecting your email efforts to enrollment goals.
Social Media Metrics
Social media is all about building a community, but it’s easy to get distracted by "vanity metrics" like follower counts. A huge following looks great on paper, but it doesn't mean anyone is actually listening. In fact, raw follower growth is increasingly seen as a less important metric across the board.
Instead, focus on metrics that measure real, human interaction:
- Engagement Rate: This is the total number of interactions (likes, comments, shares) your content gets, divided by your total followers. It's a much better sign of a healthy, active audience than a simple follower count.
- Follower Growth Rate: While the total number of followers is less critical, the rate of growth is still useful. It tells you if your content is resonating enough to consistently attract new people into your school's orbit.
Tracking the right KPIs can feel overwhelming, especially when every channel seems to have its own language. To simplify things, here's a breakdown of the most important metrics to focus on for each of your core marketing channels.
Essential Marketing KPIs by Channel
| Marketing Channel | Primary KPI | What It Measures | Secondary KPI | What It Measures |
|---|---|---|---|---|
| Website | Conversion Rate | Effectiveness at turning visitors into leads (e.g., inquiries, tour sign-ups). | Organic Traffic | Visibility in search engines and strength of SEO/content strategy. |
| Paid Ads | Return on Ad Spend (ROAS) | Direct revenue generated for every dollar spent on advertising. | Customer Acquisition Cost (CAC) | The average cost to acquire one new student through a campaign. |
| Click-Through Rate (CTR) | How compelling your email content and call-to-action are. | Conversion Rate | How many recipients completed a goal after clicking the email link. | |
| Social Media | Engagement Rate | The level of active audience interaction with your content (likes, comments, shares). | Follower Growth Rate | The pace at which you are attracting new, relevant followers. |
This table isn't exhaustive, but it provides a solid foundation. By focusing on these primary and secondary KPIs, you can cut through the noise and get a clear picture of what’s truly driving your school’s growth.
Essential Tools in Your Marketing Analytics Stack
Data is full of potential, but you need the right tools to unlock it. Building a marketing analytics stack isn't about hoarding software; it’s about choosing a smart combination of tools that work together to turn raw numbers into strategic insights. Think of it like a mechanic's toolbox: each tool has a specific job, and when used together, they let you build and maintain a high-performance marketing engine.
The world of marketing tech can feel overwhelming, but most tools fall into just a few key categories. Each one is designed to solve a different piece of the analytics puzzle. Once you understand these categories, you can build a stack that actually fits your school's needs without draining your budget.
The market for these tools is booming for a reason. In the US, the marketing analytics market grew from USD 4.58 billion to USD 5.25 billion in just one year, according to industry reports. This growth is all about organizations realizing they need these platforms to make smarter, faster decisions.
Web Analytics Platforms
Your website is your digital front door. A web analytics platform tells you who's knocking, where they came from, and what they do once they're inside. These tools are the foundation for tracking user behavior, seeing which pages resonate, and spotting where prospective families might be getting stuck.
The undisputed champion here is Google Analytics. It gives you a surprisingly deep look into everything from your traffic sources to your goal conversions, answering the most critical questions about your site's performance.
This screenshot from a Google Analytics dashboard, for instance, gives a quick, high-level overview of website traffic.

At a glance, a marketer can spot user trends, see how many sessions are happening, and check engagement metrics. It’s an instant health check for your site.
Customer Relationship Management Systems
While web analytics looks at largely anonymous visitors, a Customer Relationship Management (CRM) system is all about managing your relationships with real, named people. For a school, this is the central nervous system for every interaction you have with prospective and current families—from their first website inquiry right through to enrollment day.
CRMs like HubSpot or Salesforce are perfect for this. They help you:
- Follow each prospective student through your entire admissions funnel.
- Keep a record of every email, phone call, and campus tour to build a complete picture.
- Group your contacts into segments for incredibly personalized communication.
Ultimately, a good CRM is what connects the dots between your marketing campaigns and actual enrollment numbers, making it indispensable for proving your team's value.
Social Media and Business Intelligence Tools
Finally, a few specialized tools can round out your stack, giving you an edge on specific channels and helping you see the bigger picture.
Social Media Intelligence Tools: Platforms like Sprout Social or Hootsuite do more than the basic analytics you get from Facebook or Instagram. They let you manage all your accounts in one place, schedule content, and monitor what people are saying about your school across the web. It's your finger on the pulse of your online reputation.
Business Intelligence (BI) and Visualization Tools: This is where it all comes together. Software like Tableau or Microsoft Power BI can pull data from all your other platforms—your CRM, Google Analytics, social media, ad accounts—and merge it into a single, interactive dashboard. This is how you move beyond isolated reports to a unified view of your entire marketing performance, spotting trends you would have otherwise missed completely.
How Data-Driven Marketing Actually Impacts Your Business
It's one thing to understand the theory behind marketing analytics, but it's another to see how it really moves the needle. When you weave a data-driven approach into your marketing, you stop hoping for results and start engineering them. It’s about making tangible, measurable gains.
Consistently digging into your marketing data gives you more than just numbers on a screen—it hands you a serious competitive edge. The benefits are huge, changing everything from how you connect with your audience to where you spend your money.
Get to Know Your Customers for Real
At its heart, marketing analytics lets you see who your customers actually are and what they truly want. You can finally ditch the broad assumptions and build accurate customer profiles based on what people actually do. You’ll see which content they love, what problems get them to act, and the exact path they take before making a decision.
For example, a K-12 school might dig into their data and find that parents from a specific zip code are all over their blog posts about after-school arts programs. Armed with that insight, the school can create more content that hits that exact nerve, making their outreach far more powerful.
Put Your Budget Where It Counts
One of the first things you'll notice with marketing analytics is how it shines a spotlight on where your money is making the biggest difference. It finally answers the million-dollar question: "Which marketing channels are really working?" By tracking performance, you can confidently pull your budget from campaigns that are falling flat and double down on the ones bringing in the best returns.
When you can connect your marketing activities to clear outcomes, you can justify every dollar. The marketing budget stops looking like an expense and starts looking like a strategic investment in growth.
This is all about maximizing your efficiency. Our guide on how to measure marketing ROI gives you a solid framework for this, helping you ensure every resource is aimed at what generates real results, like more inquiries or higher enrollment.
Create Experiences People Actually Like
Data is the key to personalization that works. When you understand what people prefer and how they've interacted with you before, you can deliver experiences that feel genuinely helpful, not generic or annoying. This could be as simple as sending a follow-up email about a specific academic program a parent just looked at on your website.
This kind of personal touch builds trust and makes your relationships stronger. It proves you're paying attention and that you get their specific needs—a huge advantage in any crowded market.
Make Smarter Decisions, Faster
Finally, having a solid analytics routine makes your team incredibly agile. With real-time data ready to go, you can spot new trends the moment they pop up or see when a campaign is starting to go off the rails. This lets you pivot on a dime, making changes based on hard evidence instead of waiting for a quarterly report to tell you what went wrong last month.
That kind of speed is crucial for staying ahead. It’s no surprise the global marketing analytics market is projected to explode from USD 3.75 billion to nearly USD 21.12 billion in just over a decade. This massive growth shows just how much businesses are banking on data to be faster and more precise. You can read more about the growth of the marketing analytics market to see how this trend is reshaping the industry.
A Few Common Marketing Analytics Questions Answered
As you start digging into marketing analytics, some questions pop up time and time again. Let's clear the air on a few of the most common ones so you can move forward without getting bogged down in the details.
Is Marketing Analytics the Same as Web Analytics?
It’s an easy mistake to make, but they're definitely not the same thing.
Think of it like this: web analytics is like looking at a detailed map of just one city—your school's website. It’s fantastic for showing you what's happening within those city limits, like traffic patterns (who's visiting which pages) and popular destinations (like your inquiry form).
Marketing analytics, on the other hand, is the map of the entire country. It includes that city map of your website, but it also pulls in data from everywhere else your school has a presence—social media campaigns, email newsletters, digital ads, and even your CRM. It connects all the dots to show you the entire journey a prospective family takes, not just the slice of it that happens on your site.
Do I Need to Be a Data Scientist?
Nope. Not even close.
While a data scientist can certainly pull out some deep, complex insights, you don't need a Ph.D. in statistics to make marketing analytics work for you. Honestly, it's more about being curious and asking the right questions. The tools do the heavy lifting.
Most modern platforms are built for marketers, not data scientists. They rely on visual dashboards and clear charts to make the information digestible. Your real job is to bring your marketing brain to the table—your understanding of your audience and your school's goals—to figure out what the numbers are actually telling you.
You don't need to be a data expert to get started. You just need to be curious about what drives results and willing to let the numbers guide your decisions.
What Is a Reasonable Budget for Analytics Tools?
Here’s the great news: you can get started for free. A powerhouse tool like Google Analytics costs nothing and gives you a treasure trove of data about your website. Most social media and email platforms also have solid analytics dashboards built right in, at no extra cost.
As your school's needs get more sophisticated, you might look at paid tools. A small to mid-sized school could budget anywhere from $100 to $500 per month for a setup that includes things like a dedicated CRM or a social media management tool. The trick is to start small, show that it's working, and then expand your investment once you see a clear return.
What Is the First Step for a Small Business?
If you're just dipping your toes in the water, the single most important thing is to get your foundation right. Don't feel pressured to track a million things at once.
Instead, just do this:
Install Google Analytics on your website correctly.
That’s it. This one step unlocks the ability to understand your most valuable marketing asset. Once it's up and running, set a few simple goals, like tracking how many people complete your inquiry form. This gives you a starting point—a baseline for success—and lets you begin making smarter, data-backed decisions without spending a dime.
Ready to connect with a community that understands the unique challenges and opportunities of K-12 marketing? Join The MarCom Society to gain access to expert-led workshops, collaborative sessions, and a network of peers dedicated to data-driven success. Elevate your marketing strategy with us today.