Admitted Vs Enrolled: Understanding The Critical Distinction
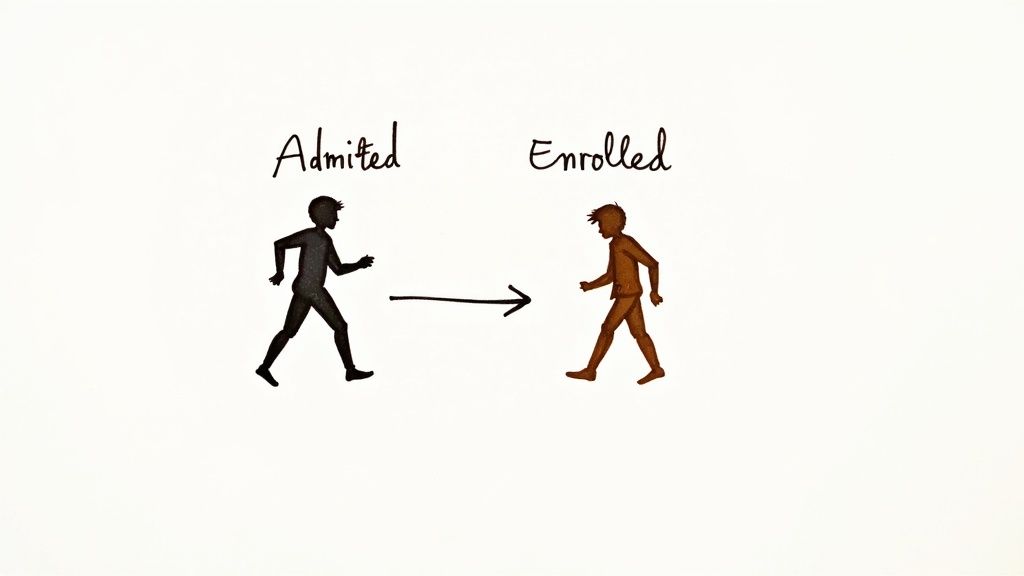
Seeing your acceptance letter is exciting, but being admitted doesn’t mean you’re officially in. This phase covers your invitation, conditions, and next steps. Understanding the move to enrolled status explains why colleges focus on yield rates and why you face important deadlines after admission.
What Does Admitted Really Mean?
The admitted status is your formal invitation to join a college or university. It often comes with requirements you must meet before you can commit.
- It confirms that the admissions team has accepted your application.
- You’ll receive deposit deadlines and instructions on submitting paperwork.
- Financial aid estimates and potential scholarships are outlined.
- Conditions may include final transcripts, test scores, or health records.
- Your spot isn’t secured until you submit the enrollment deposit.
What Is Enrollment And Why It Matters
Once you accept the offer and pay the deposit, you move into enrolled status—this locks in your place in the class.
- You gain access to student portals, orientation events, and housing selection.
- The institution finalizes resources like faculty assignments and classroom space.
- Your financial aid package is confirmed and billing statements are issued.
- You can register for courses and plan your academic schedule.
Admitted Vs Enrolled: At A Glance
| Aspect | Admitted | Enrolled |
|---|---|---|
| Definition | Invitation to join | Official commitment after deposit |
| Timing | Upon acceptance decision | After deposit payment and paperwork |
| Institutional Impact | Forecast yield and manage waitlists | Allocate seats, housing, and class sections |
| Student Action | Review offers, compare options, decide | Submit deposit, register for courses |
National trends remind us that not every admitted student becomes enrolled. In the United States, undergraduates numbered 19.28 million in Fall 2024, down from 21.0 million in 2010. The overall enrollment rate for 18- to 24-year-olds fell from 41% in 2012 to 39% in 2022, highlighting the gap between admission offers and actual attendance. Discover more about college enrollment trends.
Distinguishing these two stages equips you to track deadlines, weigh financial factors, and plan campus visits. With clarity on when you hold an invitation versus when your spot is confirmed, you can navigate your path forward with confidence.
Navigating Your Path From Admission Letter To Enrolled Status

Your acceptance letter marks the moment you shift from admitted status to plotting your enrolled path. It’s like receiving a wedding invitation: you still need to RSVP, pick your menu, and confirm your seat. Each deadline you meet brings you closer to that first campus day.
Key Steps To Secure Your Spot
After admission, most colleges list 5 crucial tasks:
- Admission Deposit: Submit by May 1
- Housing Application: Complete by May 15
- Orientation Registration: Sign up by June 1
- Academic Advising: Book an appointment early
- Financial Aid Finalization: Confirm your awards
Missing just one item can push you onto waitlists or limit course options. Treat this as a unified plan to move smoothly from admitted to enrolled.
Maximizing Orientation And Course Registration
Orientation offers a hands-on start for building your schedule:
- Arrive early to secure your preferred session
- Join breakout groups to review general requirements
- Experiment with online planners to draft your timetable
- Connect with peer mentors for firsthand tips
Think of orientation as a mini-conference to gain priority access to popular courses and advisors.
Institutions’ Communication And Incentive Programs
Campuses increase their yield by:
- Hosting Accepted Student Days with faculty Q&A sessions
- Arranging one-on-one calls from peer ambassadors
- Offering webinars on scholarships and billing
- Sending deadline reminders via text and email
These touchpoints support your decision and keep deadlines top of mind.
Enrollment Timeline At A Glance
| Step | Deadline | Purpose |
|---|---|---|
| Pay Admission Deposit | May 1 | Locks in your enrolled status |
| Submit Housing App | May 15 | Secures room and roommate options |
| Register Orientation | June 1 | Selects your session times |
| Course Registration | July 15 | Finalizes your semester schedule |
With these milestones on your calendar, moving from admitted to enrolled is far more straightforward. Remember to download your student ID, activate your campus email, and join online student groups before move-in day. Soon you’ll be walking the quad as a fully enrolled student ready to begin your journey.
Why Brilliant Students Don’t Always Show Up on Day One
Understanding Summer Melt
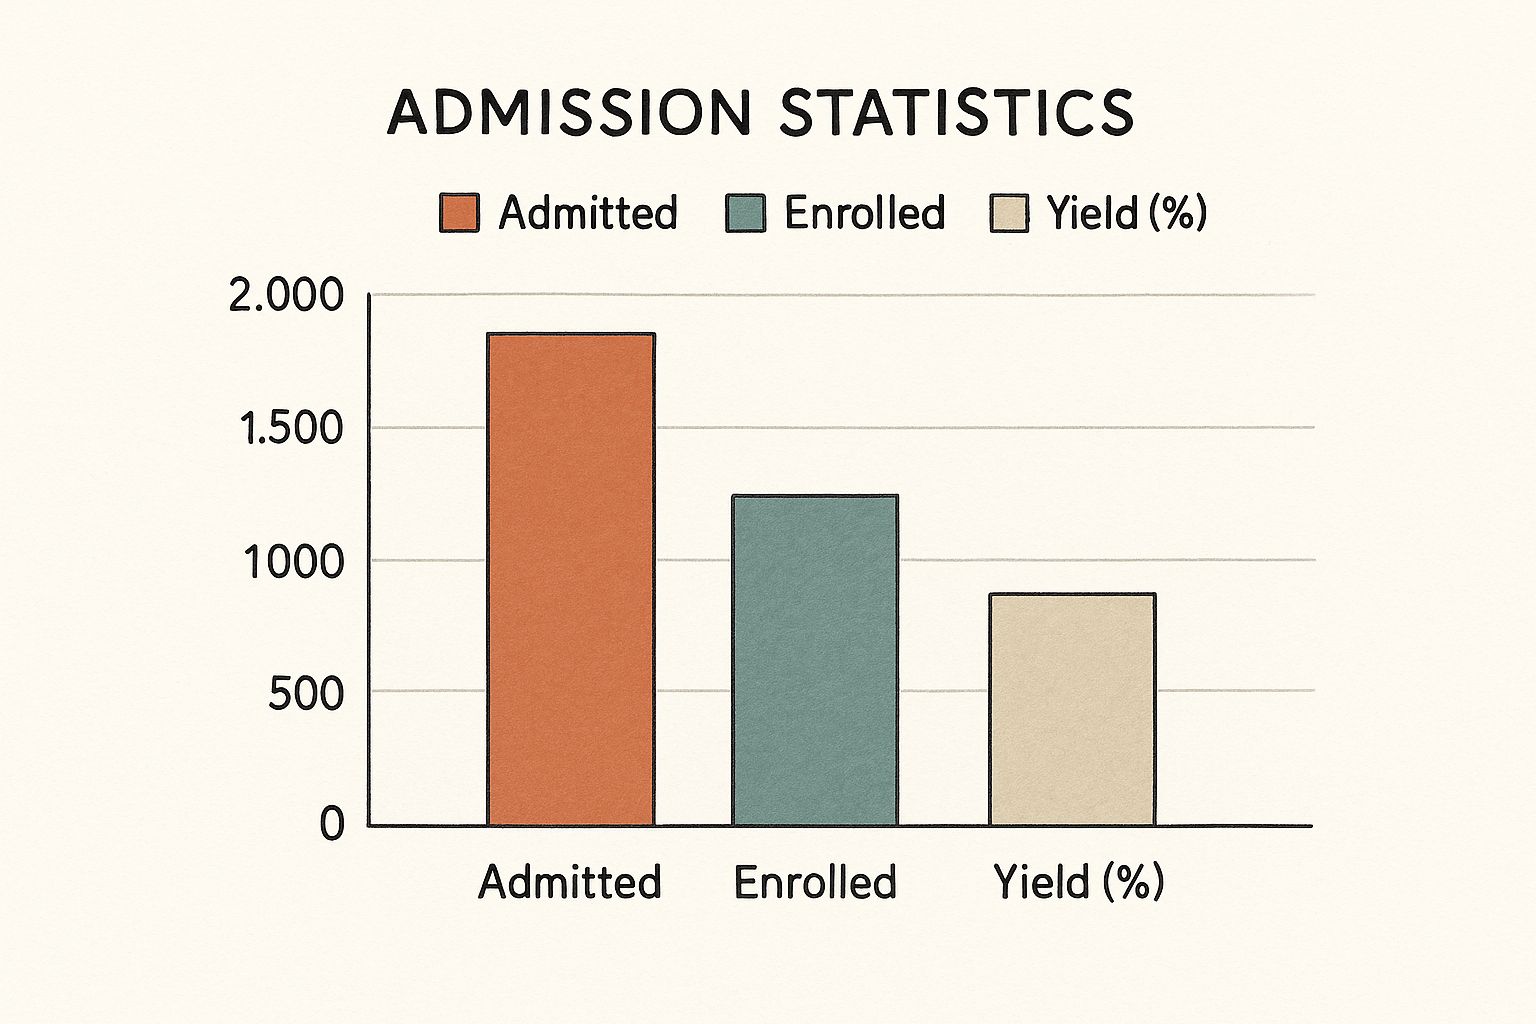
At the heart of the drop-off between admitted vs enrolled is something educators call summer melt. Each year, up to 40% of students who pay a deposit never step foot on campus once classes start. Universities scramble to fill those seats while trying to understand the root causes. This gap goes beyond paperwork—it reflects challenges students face during the break.
Key Factors Behind Changed Minds
Financial surprises often lead the list. A family might plan based on an initial aid estimate, only to see room and board costs rise unexpectedly. Late scholarship packages—sometimes arriving after deposit deadlines—can prompt students to switch schools. Distance and uncertainty about campus life, especially when a virtual tour falls short, also play a role. These factors combine to widen the gap between admission and enrollment.
The following data chart visualizes the most common factors leading to summer melt, showing each reason’s share of the problem and strategies institutions can use to address them.
Top Reasons Admitted Students Don’t Enroll
This table presents the most common factors that prevent admitted students from completing enrollment, along with percentage impact and potential solutions for institutions
| Reason | Percentage Impact | Institutional Strategy |
|---|---|---|
| Financial Constraints | 30% | Emergency grants & flexible payment plans |
| Scholarship Timing | 25% | Early award notifications |
| Program Fit Concerns | 20% | Major-specific webinars & Q&A sessions |
| Geographic Limitations | 15% | Local admit events & enhanced virtual tours |
| Personal Circumstances | 10% | One-on-one advising and support calls |
The data chart highlights that more than 55% of summer melt cases stem from cost issues and delayed scholarships. Clear, timely communication about finances can help students move from admitted to enrolled.
Spotting the Warning Signs
Institutions monitor small digital cues to spot students at risk:
- Declining email open rates after deposit deadlines
- Low attendance at admitted-student webinars or orientations
- Uncompleted housing or health-record submissions
- Hesitation to schedule advising appointments
When these red flags appear, timely outreach can restore confidence and guide students back toward enrollment.
Institutional Strategies to Reduce Melt
To improve the admitted-to-enrolled conversion, colleges use targeted tactics:
- Personalized financial check-ins before summer break
- Flexible deposit options to ease upfront costs
- Peer ambassador calls to reinforce community connections
- Interactive virtual events showcasing student life
- Dedicated case managers for complex personal issues
By tackling the top drivers of summer melt, colleges can shrink the admitted-vs-enrolled gap and ensure brilliant students arrive on Day One.
Global Perspectives: How Admitted vs Enrolled Varies Worldwide

Across regions, the path from admission to enrollment depends on local customs, funding models, and institutional capacity. In countries with strong financial aid networks, more students move smoothly from acceptance to registration. In contrast, areas with limited resources often see a significant gap between admitted and actually enrolled students. Understanding these trends equips students and administrators to make informed choices.
High Conversion Rates In Developed Regions
In Europe and North America, the gross enrollment rate reached 79% in 2020, reflecting well-funded systems and comprehensive support. Institutions here routinely report conversion rates above 85%, meaning most accepted applicants complete enrollment.
- Guaranteed financial aid packages ensure students cover tuition and living costs
- Extensive orientation programs help new students navigate academic and social life
- Clear housing and course-planning processes reduce administrative hurdles
These elements work together to drive high enrollment. For more details, see the UNESCO Higher Education Global Data Report.
Challenges In Developing Regions
In Sub-Saharan Africa, the gross enrollment rate was just 9% in 2020, highlighting infrastructure gaps and financial barriers. Many admitted students cannot afford tuition or campus housing, and they often face pressures to enter the workforce early.
- Economic constraints on tuition and living costs
- Inadequate campus facilities and student housing
- Early career demands that pull students away from studies
Such obstacles widen the divide between admission offers and actual enrollment figures.
Mid-Tier Systems: Asia And Latin America
Institutions in Asia and Latin America typically fall between the extremes, achieving conversion rates of 60–75% thanks to expanding scholarship programs and growing campus capacity.
| Region | Gross Enrollment Rate (2020) | Admission-to-Enrollment Conversion |
|---|---|---|
| Europe & North America | 79% | 90% |
| Asia | 48% | 70% |
| Latin America | 55% | 65% |
| Sub-Saharan Africa | 9% | 20% |
Lessons For Students Considering International Study
Recognizing these global patterns helps you anticipate how your admission might translate into enrollment abroad. Before you decide, consider the following:
- Research scholarship and financial aid options early
- Check campus housing availability and class capacity
- Evaluate local financial and cultural support systems
- Connect with admitted-student groups online
Main takeaway: Regions with stronger support frameworks convert far more admitted applicants into enrolled students, creating clearer pathways for international study.
Behind the Numbers: How Schools Track Your Decision Journey
Colleges view the shift from admitted vs enrolled as a detailed project, tracking every RSVP and seating assignment. Admissions teams calculate yield rates to forecast how many students will arrive on move-in day, guiding decisions about class sizes, housing allocations, and dining services.
Instead of simply mailing acceptance letters, schools analyze enrollment patterns to balance resources with actual demand and keep campus operations running smoothly.
Core Metrics Enrollment Teams Analyze
Enrollment managers rely on several key indicators to narrow the gap between admitted and enrolled students:
- Yield Rate: (Enrolled ÷ Admitted) × 100
- Engagement Score: Weighted sum of campus visits, webinar attendance, and email interactions
- Deposit Timing: Average days between an admission offer and the paid deposit
- Waitlist Movement: Percentage of waitlisted students who commit after May 1
Tracking these metrics helps teams decide when to open extra course sections or call up waitlist candidates, ensuring that staffing and facilities match real interest.
Predictive Modeling in Practice
Institutions use predictive models much like meteorologists forecast storms. By feeding historical yield data and engagement trends into algorithms, they anticipate surges in deposit submissions or last-minute withdrawals.
Interviews with enrollment professionals reveal that a 5% uptick in campus-tour attendance often translates to a 3% higher enrollment conversion. That insight directly informs staffing levels and event planning for admitted students.
Key Metrics in Admission vs Enrollment Analysis
Below is a comprehensive overview of the metrics institutions use to evaluate the relationship between admissions and enrollment, with formulas and benchmark ranges.
| Metric | Formula | Industry Average | Significance |
|---|---|---|---|
| Yield Rate | (Enrolled ÷ Admitted) × 100 | 45% | Measures conversion efficiency |
| Engagement Score | Σ (Visit × 2 + Webinar × 1 + Email × 0.5) | 120 points | Predicts likelihood of commitment |
| Deposit Timing | Avg days to deposit after admission offer | 14 days | Signals decision speed |
| Waitlist Movement | (Waitlist enrollees ÷ Waitlist admits) × 100 | 30% | Guides timing for new offers |
This table highlights how each metric focuses on a distinct stage of the admission-to-enrollment pipeline, enabling teams to refine outreach strategies and allocate resources more effectively.
Digital Footprints That Matter
Small online interactions can offer big clues about student intent:
- Portal logins tracking application checklist completion
- Email open and click rates on financial aid updates
- Campus-map clicks indicating housing interest
- Attendance at virtual Q&A sessions with faculty
By monitoring these digital footprints, schools can identify students who may need extra guidance before they decide not to enroll.
Benchmarking And Technology Trends
Institutions compare their yield rates and engagement scores against peer groups to spot areas for improvement. Many now use AI-driven platforms to automate reminders, personalize chat-bot replies, and simulate different deposit-deadline scenarios.
Main takeaway: Knowing how colleges track your decision journey reveals why you receive targeted follow-ups—and shows you when and how to respond.
Making Informed Decisions: What This Means for Your Future
Navigating the admitted vs enrolled transition isn’t just about ticking deadlines—it’s about choosing the right path for long-term success. For students and families, that decision relies on clear comparisons, thorough research and candid discussions. At the same time, K-12 marketing and communication teams need to refine outreach to improve enrollment yield without promising more than they can deliver.
Evidence-Based Strategies for Students and Families
When weighing offers, focus on these four pillars:
- Cost Transparency: Review tuition, fees and housing costs, and forecast annual increases. For instance, 58% of families point to unexpected fees as a major enrollment obstacle.
- Academic Fit: Match program requirements, faculty-student ratios and graduation rates against your objectives.
- Campus Culture: Join admitted-student events, tune in to virtual panels or connect with current students to spot warning signs.
- Long-Term ROI: Weigh expected career earnings against total debt. Some lower-cost schools deliver a higher net return over time.
Chadview shares planning advice on its blog. Explore Financial Planning Tips for guidance on budgeting and campus visits.
Proven Tactics for Educators and Administrators
Schools that strengthen their admitted-to-enrolled pipeline often use a structured plan:
| Strategy | Description | Expected Impact |
|---|---|---|
| Personalized Outreach | One-on-one calls or texts after deposit | Boosts yield by 5% |
| Interactive Virtual Events | Small-group webinars led by faculty or current students | Increases engagement |
| Wait-List Management | Regular, transparent updates for wait-listed students | Fills seats efficiently |
Main Takeaway: Timely, targeted communication can reduce summer melt by up to 20%.
Emerging Trends Shaping the Admitted vs Enrolled Pipeline
Several factors will influence enrollment decisions:
- Demographic Shifts: Declining birth rates in certain areas mean fewer applicants and more competition.
- Technological Tools: AI-driven chatbots and predictive analytics help automate follow-up, while personal outreach builds trust.
- Changing Expectations: Families now expect real-time updates on housing, costs and career support—often through mobile apps.
Blending data with genuine conversation ensures every admitted student feels acknowledged and supported.
Ready to refine your enrollment approach and network with peers? Join The MarCom Society for workshops, peer learning and practical playbooks tailored to K-12 marketing and communications professionals.